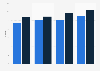
This statistic displays the total number of people who got married in the Netherlands in 2022, by age and gender. It shows that in 2022 over 17,100 men aged 30-35 got married.
Advertisement
Advertisement
Number of people who got married in the Netherlands in 2022, by age and gender
Profit from the additional features of your individual account
Currently, you are using a shared account. To use individual functions (e.g., mark statistics as favourites, set
statistic alerts) please log in with your personal account.
If you are an admin, please authenticate by logging in again.
Learn more about how Statista can support your business.
Centraal Bureau voor de Statistiek. (August 18, 2023). Number of people who got married in the Netherlands in 2022, by age and gender [Graph]. In Statista. Retrieved June 27, 2025, from https://www.statista.com/statistics/524874/netherlands-number-of-grooms-and-brides-by-age-and-gender/
Centraal Bureau voor de Statistiek. "Number of people who got married in the Netherlands in 2022, by age and gender." Chart. August 18, 2023. Statista. Accessed June 27, 2025. https://www.statista.com/statistics/524874/netherlands-number-of-grooms-and-brides-by-age-and-gender/
Centraal Bureau voor de Statistiek. (2023). Number of people who got married in the Netherlands in 2022, by age and gender. Statista. Statista Inc.. Accessed: June 27, 2025. https://www.statista.com/statistics/524874/netherlands-number-of-grooms-and-brides-by-age-and-gender/
Centraal Bureau voor de Statistiek. "Number of People Who Got Married in The Netherlands in 2022, by Age and Gender." Statista, Statista Inc., 18 Aug 2023, https://www.statista.com/statistics/524874/netherlands-number-of-grooms-and-brides-by-age-and-gender/
Centraal Bureau voor de Statistiek, Number of people who got married in the Netherlands in 2022, by age and gender Statista, https://www.statista.com/statistics/524874/netherlands-number-of-grooms-and-brides-by-age-and-gender/ (last visited June 27, 2025)
Number of people who got married in the Netherlands in 2022, by age and gender [Graph], Centraal Bureau voor de Statistiek, August 18, 2023. [Online]. Available: https://www.statista.com/statistics/524874/netherlands-number-of-grooms-and-brides-by-age-and-gender/