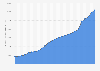
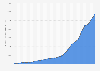
From 2013 to 2015, the central government debt relative to GDP steadily increased in Finland, reaching a high of 57 percent in 2015. Thereafter, the central government debt to GDP ratio declined, but peaking at 63.1 percent again in 2023. At the same time, the financial position of local government continued to weaken, and as of 2023, the debt in relation to GDP reached 12.7 percent.
Advertisement
Advertisement
General government debt in relation to gross domestic product (GDP) in Finland from 2013 to 2023, by sector
Profit from the additional features of your individual account
Currently, you are using a shared account. To use individual functions (e.g., mark statistics as favourites, set
statistic alerts) please log in with your personal account.
If you are an admin, please authenticate by logging in again.
Learn more about how Statista can support your business.
Statistics Finland. (April 19, 2024). General government debt in relation to gross domestic product (GDP) in Finland from 2013 to 2023, by sector [Graph]. In Statista. Retrieved July 15, 2025, from https://www.statista.com/statistics/525569/general-government-debt-to-gdp-ratio-by-sector-finland/
Statistics Finland. "General government debt in relation to gross domestic product (GDP) in Finland from 2013 to 2023, by sector." Chart. April 19, 2024. Statista. Accessed July 15, 2025. https://www.statista.com/statistics/525569/general-government-debt-to-gdp-ratio-by-sector-finland/
Statistics Finland. (2024). General government debt in relation to gross domestic product (GDP) in Finland from 2013 to 2023, by sector. Statista. Statista Inc.. Accessed: July 15, 2025. https://www.statista.com/statistics/525569/general-government-debt-to-gdp-ratio-by-sector-finland/
Statistics Finland. "General Government Debt in Relation to Gross Domestic Product (Gdp) in Finland from 2013 to 2023, by Sector." Statista, Statista Inc., 19 Apr 2024, https://www.statista.com/statistics/525569/general-government-debt-to-gdp-ratio-by-sector-finland/
Statistics Finland, General government debt in relation to gross domestic product (GDP) in Finland from 2013 to 2023, by sector Statista, https://www.statista.com/statistics/525569/general-government-debt-to-gdp-ratio-by-sector-finland/ (last visited July 15, 2025)
General government debt in relation to gross domestic product (GDP) in Finland from 2013 to 2023, by sector [Graph], Statistics Finland, April 19, 2024. [Online]. Available: https://www.statista.com/statistics/525569/general-government-debt-to-gdp-ratio-by-sector-finland/