
Aaron O'Neill
Research lead for society, economy, and politics: Europe & global
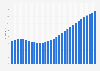
Get in touch with us nowFluctuating rise between 2000 and 2025
Between 2000 and 2025 a total increase by approximately 14.44 percentage points can be observed. The data emphasizes however that this increase did not happen continuously.
Continuous decline between 2025 and 2030
In 2030 the ratio will be roughly 20.98 percent, according to forecasts. This indicates an overall decrease by approximately 3 percentage points since 2025. This decrease reflects a consistent falling trend.
Shown here is the general government expenditure as a share of the national gross domestic product. As defined by the International Monetary Fund, the general government expenditure consists of total expense and the net acquisition of nonfinancial assets. The gross domestic product represents the total value of final goods and services produced during a year.
* For commercial use only
Basic Account
Starter Account
Professional Account
1 All prices do not include sales tax. The account requires an annual contract and will renew after one year to the regular list price.
Population
Economy
State finances
Further related statistics
* For commercial use only
Basic Account
Starter Account
Professional Account
1 All prices do not include sales tax. The account requires an annual contract and will renew after one year to the regular list price.