The number of employed people in Sweden increased annually after the financial crisis in 2009 until the outbreak of COVID-19. In 2022, nearly 5.2 million of the total population of 10.5 million people were employed. The increase in the number of employees over the past 10 years is partly related to the increase of the working age population that occurred during the same period.
The employment rate
Furthermore, the employment rate in Sweden followed the same pattern as the number of employed people. The employment rate was at its lowest in 2010, when it was 64.4 percent, which was a consequence of the financial crisis in 2008 and 2009. The employment rate also experienced a drop in 2020 due to the effects of the corona crisis (COVID-19).
Different employment rates for men and women
Employment rates in Sweden are high among both men and women, but are still lower among the latter. In 2022, the rate was nearly 72 percent among men, whereas it was 66 percent among women. Moreover, the drop was by 1.6 percentage points among women in 2020 after the outbreak of COVID-19, but only 0.7 percentage points among men.
Advertisement
Advertisement
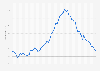
Number of employed people in Sweden from 2001 to 2022
(in 1,000s)
Characteristic
Employed people in thousands
2022
5,197
2021
5,058.5
2020
5,064.3
2019
5,131.6
2018
5,097.4
2017
5,021.8
2016
4,910.1
2015
4,837.2
2014
4,772.3
2013
4,704.7
2012
4,657.1
2011
4,625.9
2010
4,523.7
2009
4,498.7
2008
4,593
2007
4,540.7
2006
4,429.4
2005
4,347.6
2004
4,332.6
2003
4,350.5
2002
4,361.5
2001
4,347.4
Zoomable Statistic: Select the range in the chart you want to zoom in on.
Profit from the additional features of your individual account
Currently, you are using a shared account. To use individual functions (e.g., mark statistics as favourites, set
statistic alerts) please log in with your personal account.
If you are an admin, please authenticate by logging in again.
Learn more about how Statista can support your business.
Statistics Sweden. (January 27, 2023). Number of employed people in Sweden from 2001 to 2022 (in 1,000s) [Graph]. In Statista. Retrieved June 26, 2025, from https://www.statista.com/statistics/527454/sweden-number-of-employed-people/
Statistics Sweden. "Number of employed people in Sweden from 2001 to 2022 (in 1,000s)." Chart. January 27, 2023. Statista. Accessed June 26, 2025. https://www.statista.com/statistics/527454/sweden-number-of-employed-people/
Statistics Sweden. (2023). Number of employed people in Sweden from 2001 to 2022 (in 1,000s). Statista. Statista Inc.. Accessed: June 26, 2025. https://www.statista.com/statistics/527454/sweden-number-of-employed-people/
Statistics Sweden. "Number of Employed People in Sweden from 2001 to 2022 (in 1,000s)." Statista, Statista Inc., 27 Jan 2023, https://www.statista.com/statistics/527454/sweden-number-of-employed-people/
Statistics Sweden, Number of employed people in Sweden from 2001 to 2022 (in 1,000s) Statista, https://www.statista.com/statistics/527454/sweden-number-of-employed-people/ (last visited June 26, 2025)
Number of employed people in Sweden from 2001 to 2022 (in 1,000s) [Graph], Statistics Sweden, January 27, 2023. [Online]. Available: https://www.statista.com/statistics/527454/sweden-number-of-employed-people/