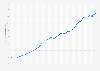
The U.S. tech giant Apple has reduced its overall greenhouse gas (GHG) emissions by more than ** percent since 2015, having reported gross emissions of **** million metric tons of carbon dioxide equivalent (MtCO₂e) in FY 2024. When carbon offsets are taken into account, Apple's net emissions were **** MtCO₂e.
Where do Apple’s emissions come from?
The majority of Apple’s carbon footprint comes from Scope 3 product life cycle emissions. In FY 2024, product manufacturing accounted for around ** percent of the company’s gross GHG emissions, while product transportation was responsible for roughly ** percent. In FY 2024, Apple reduced emissions from the product manufacturing and product use sectors by ** and **** percent compared with FY 2023, respectively.
Apple’s carbon neutrality goal
Apple has achieved its emissions reductions in several ways since 2015, including using low-carbon materials, sourcing 100 percent renewable energy at its facilities, and transitioning its suppliers to renewable energy. The company now aims to achieve carbon neutrality across its entire value chain by 2030. This goal will require a ** percent reduction in gross GHG emissions compared with 2015 baseline levels and applying carbon removals for the remaining emissions.
*Offsets included since FY 2020. Fiscal years end on various dates at the end of September. This statistic has been compiled from multiple annual reports
Profit from the additional features of your individual account
Currently, you are using a shared account. To use individual functions (e.g., mark statistics as favourites, set
statistic alerts) please log in with your personal account.
If you are an admin, please authenticate by logging in again.
Learn more about how Statista can support your business.
Apple. (April 16, 2025). Greenhouse gas emissions of Apple Inc. from FY 2012 to FY 2024 (in million metric tons of carbon dioxide equivalent) [Graph]. In Statista. Retrieved July 06, 2025, from https://www.statista.com/statistics/528604/carbon-emissions-from-apple-by-segment/
Apple. "Greenhouse gas emissions of Apple Inc. from FY 2012 to FY 2024 (in million metric tons of carbon dioxide equivalent)." Chart. April 16, 2025. Statista. Accessed July 06, 2025. https://www.statista.com/statistics/528604/carbon-emissions-from-apple-by-segment/
Apple. (2025). Greenhouse gas emissions of Apple Inc. from FY 2012 to FY 2024 (in million metric tons of carbon dioxide equivalent). Statista. Statista Inc.. Accessed: July 06, 2025. https://www.statista.com/statistics/528604/carbon-emissions-from-apple-by-segment/
Apple. "Greenhouse Gas Emissions of Apple Inc. from Fy 2012 to Fy 2024 (in Million Metric Tons of Carbon Dioxide Equivalent)." Statista, Statista Inc., 16 Apr 2025, https://www.statista.com/statistics/528604/carbon-emissions-from-apple-by-segment/
Apple, Greenhouse gas emissions of Apple Inc. from FY 2012 to FY 2024 (in million metric tons of carbon dioxide equivalent) Statista, https://www.statista.com/statistics/528604/carbon-emissions-from-apple-by-segment/ (last visited July 06, 2025)
Greenhouse gas emissions of Apple Inc. from FY 2012 to FY 2024 (in million metric tons of carbon dioxide equivalent) [Graph], Apple, April 16, 2025. [Online]. Available: https://www.statista.com/statistics/528604/carbon-emissions-from-apple-by-segment/