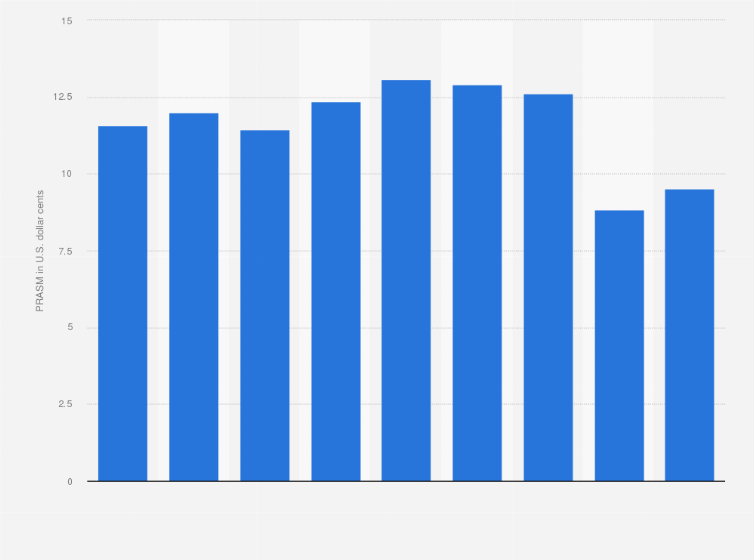
The statistic shows Hawaiian Holdings Inc.'s passenger revenue per available seat mile (PRASM) for scheduled operations between the fiscal year of 2013 and the fiscal year of 2021. In the fiscal year of 2021, the company's airline business recorded passenger revenue of 9.51 U.S. dollar cents for each available seat mile.
Hawaiian Holding Inc.'s passenger revenue per available seat mile from FY 2013 to FY 2021
(in U.S. dollar cents)
Adjust the presentation of the statistic and data points.
Share the statistic on social media channels or embed the statistic in your
website using "Embed Code", where available.
Cite this statistic and select one of the following formats: APA, Chicago, Harvard, MLA & Bluebook.
Print the statistic including description and metadata.
Chart type
Hawaiian Holding Inc.'s passenger revenue per available seat mile from FY 2013 to FY 2021
Share this statistic
You have no right to use this feature.
Make sure to contact us if you are interested in scientific citation.
You can upgrade your account to enable this functionality for all statistics.
This feature is not available with your current account.Request access
Learn more about how Statista can support your business.
Hawaiian Airlines. (February 10, 2022). Hawaiian Holding Inc.'s passenger revenue per available seat mile from FY 2013 to FY 2021 (in U.S. dollar cents) [Graph]. In Statista. Retrieved May 17, 2025, from https://www.statista.com/statistics/529362/passenger-revenue-available-seat-mile-of-hawaiian-airlines/
Hawaiian Airlines. "Hawaiian Holding Inc.'s passenger revenue per available seat mile from FY 2013 to FY 2021 (in U.S. dollar cents)." Chart. February 10, 2022. Statista. Accessed May 17, 2025. https://www.statista.com/statistics/529362/passenger-revenue-available-seat-mile-of-hawaiian-airlines/
Hawaiian Airlines. (2022). Hawaiian Holding Inc.'s passenger revenue per available seat mile from FY 2013 to FY 2021 (in U.S. dollar cents). Statista. Statista Inc.. Accessed: May 17, 2025. https://www.statista.com/statistics/529362/passenger-revenue-available-seat-mile-of-hawaiian-airlines/
Hawaiian Airlines. "Hawaiian Holding Inc.'s Passenger Revenue per Available Seat Mile from Fy 2013 to Fy 2021 (in U.S. Dollar Cents)." Statista, Statista Inc., 10 Feb 2022, https://www.statista.com/statistics/529362/passenger-revenue-available-seat-mile-of-hawaiian-airlines/
Hawaiian Airlines, Hawaiian Holding Inc.'s passenger revenue per available seat mile from FY 2013 to FY 2021 (in U.S. dollar cents) Statista, https://www.statista.com/statistics/529362/passenger-revenue-available-seat-mile-of-hawaiian-airlines/ (last visited May 17, 2025)
Hawaiian Holding Inc.'s passenger revenue per available seat mile from FY 2013 to FY 2021 (in U.S. dollar cents) [Graph], Hawaiian Airlines, February 10, 2022. [Online]. Available: https://www.statista.com/statistics/529362/passenger-revenue-available-seat-mile-of-hawaiian-airlines/
Profit from additional features with an Employee Account
Please create an employee account to be able to mark statistics as favorites.
Then you can access your favorite statistics via the star in the header.
Profit from the additional features of your individual account
Currently, you are using a shared account. To use individual functions (e.g., mark statistics as favourites, set
statistic alerts) please log in with your personal account.
If you are an admin, please authenticate by logging in again.