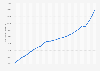
From 2006 to 2021, income in Belgium varied on a regional scale. Firstly, the average annual income was higher in the Flemish region than in the rest of the country. Secondly, Wallonia had an average income higher than in the Brussels-Capital Region. Furthermore, from 2006 to 2021, the increase in income was higher in Flanders than in the other parts of Belgium. Indeed, Flanders’ annual income increased by roughly 7,000 euros over this period, whereas Wallonia faced an increase of 6,000 euros. Meanwhile, the Brussels-Capital Region registered an increase of 4,000 euros. In other words, not only did the annual income differ from one region to another, but regional inequalities were also deepening over time.
Further uneven distribution of income in Belgium?
On a European level, Belgium held the fifth position of the European Union countries with the highest annual salaries in 2017. During that year, the average annual income in Belgium reached 18,331 euros. However, income in Belgium varied by level of education, age, and, still to this day, gender. In spite of this, the average income is a major indicator of the level of development of a country and its population's general standard of living.
You have no right to use this feature.
Make sure to contact us if you are interested in scientific citation.
You can upgrade your account to enable this functionality for all statistics.
This feature is not available with your current account.Request access
* Statistics Belgium defines the average annual income per inhabitants as the quotient of the total net taxable income and the population on January 1, of that reference year.
Belgium is divided into three regions: the Flemish Region, the Brussels-Capital Region and the Walloon Region. Each region has its own Regional Parliament and a Regional Government.
Learn more about how Statista can support your business.
Statbel. (October 26, 2023). Average annual income in Belgium from 2006 to 2021, by region (in euros) [Graph]. In Statista. Retrieved May 17, 2025, from https://www.statista.com/statistics/529686/average-annual-income-in-belgium-by-region/
Statbel. "Average annual income in Belgium from 2006 to 2021, by region (in euros)." Chart. October 26, 2023. Statista. Accessed May 17, 2025. https://www.statista.com/statistics/529686/average-annual-income-in-belgium-by-region/
Statbel. (2023). Average annual income in Belgium from 2006 to 2021, by region (in euros). Statista. Statista Inc.. Accessed: May 17, 2025. https://www.statista.com/statistics/529686/average-annual-income-in-belgium-by-region/
Statbel. "Average Annual Income in Belgium from 2006 to 2021, by Region (in Euros)." Statista, Statista Inc., 26 Oct 2023, https://www.statista.com/statistics/529686/average-annual-income-in-belgium-by-region/
Statbel, Average annual income in Belgium from 2006 to 2021, by region (in euros) Statista, https://www.statista.com/statistics/529686/average-annual-income-in-belgium-by-region/ (last visited May 17, 2025)
Average annual income in Belgium from 2006 to 2021, by region (in euros) [Graph], Statbel, October 26, 2023. [Online]. Available: https://www.statista.com/statistics/529686/average-annual-income-in-belgium-by-region/
Profit from additional features with an Employee Account
Please create an employee account to be able to mark statistics as favorites.
Then you can access your favorite statistics via the star in the header.
Profit from the additional features of your individual account
Currently, you are using a shared account. To use individual functions (e.g., mark statistics as favourites, set
statistic alerts) please log in with your personal account.
If you are an admin, please authenticate by logging in again.