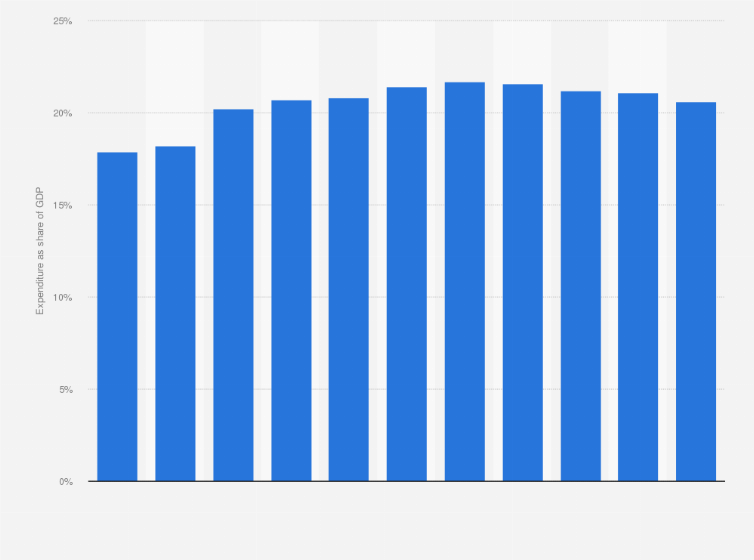
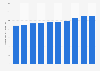
Government expenditure on social benefits in the Netherlands 2007-2017
This statistic displays the government expenditure on social benefits in the Netherlands as share of GDP from 2007 to 2017. It shows that in 2017, the government in the Netherlands spent 20.6 percent of GDP on social benefits.