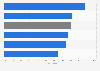
The municipality sector in Sweden had the highest average of sick days per person in all quarters of 2022. Moreover, the first quarter of the year was the quarter with the highest number of sick days across al sectors. Non-profit institutions serving households had the lowest number of sick days in Sweden that year.
Quarterly average number of sick days per employee in Sweden in 2022, by sector
Characteristic
Q1
Q2
Q3
Q4
Region
3.69
2.18
2.3
2.99
Municipality
4.46
2.37
2.5
3.42
Central government
2.31
1.34
1.39
1.82
Non-profit institutions serving households
2.24
1.17
1.31
1.8
Business sector
2.62
1.36
1.64
1.84
012345
Add this content to your personal favorites. These can be accessed from the favorites menu in the main navigation.
You have no right to use this feature.
Make sure to contact us if you are interested in scientific citation.
You can upgrade your account to enable this functionality for all statistics.
This feature is not available with your current account.Request access
Learn more about how Statista can support your business.
Statistics Sweden. (March 7, 2023). Quarterly average number of sick days per employee in Sweden in 2022, by sector [Graph]. In Statista. Retrieved June 05, 2025, from https://www.statista.com/statistics/535410/sweden-quarterly-average-number-of-sick-days-per-employee-by-sector/
Statistics Sweden. "Quarterly average number of sick days per employee in Sweden in 2022, by sector." Chart. March 7, 2023. Statista. Accessed June 05, 2025. https://www.statista.com/statistics/535410/sweden-quarterly-average-number-of-sick-days-per-employee-by-sector/
Statistics Sweden. (2023). Quarterly average number of sick days per employee in Sweden in 2022, by sector. Statista. Statista Inc.. Accessed: June 05, 2025. https://www.statista.com/statistics/535410/sweden-quarterly-average-number-of-sick-days-per-employee-by-sector/
Statistics Sweden. "Quarterly Average Number of Sick Days per Employee in Sweden in 2022, by Sector." Statista, Statista Inc., 7 Mar 2023, https://www.statista.com/statistics/535410/sweden-quarterly-average-number-of-sick-days-per-employee-by-sector/
Statistics Sweden, Quarterly average number of sick days per employee in Sweden in 2022, by sector Statista, https://www.statista.com/statistics/535410/sweden-quarterly-average-number-of-sick-days-per-employee-by-sector/ (last visited June 05, 2025)
Quarterly average number of sick days per employee in Sweden in 2022, by sector [Graph], Statistics Sweden, March 7, 2023. [Online]. Available: https://www.statista.com/statistics/535410/sweden-quarterly-average-number-of-sick-days-per-employee-by-sector/
Profit from additional features with an Employee Account
Please create an employee account to be able to mark statistics as favorites.
Then you can access your favorite statistics via the star in the header.
Profit from the additional features of your individual account
Currently, you are using a shared account. To use individual functions (e.g., mark statistics as favourites, set
statistic alerts) please log in with your personal account.
If you are an admin, please authenticate by logging in again.