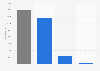
This statistic displays the number of jobs in the Netherlands in 2022, by age, in thousands. As of 2022, employment numbers were highest amongst workers aged between 50 and 54 years. Employees in this age group held 958,000 jobs.
Advertisement
Advertisement
Number of jobs in the Netherlands in 2022, by age
(in 1,000s)
The source adds: "an employed person may have more than one job at a time. In that case the person has a main job and a secondary job. Each job counts separately. For the calculation of the average number of jobs in a certain period the starting date and end date of a job is taking into account. The weekly working hours are left out of account. Two successive jobs both with a 6-month working period will always count as one job in the average number of jobs, regardless of whether these jobs are full-time or part-time."
Profit from the additional features of your individual account
Currently, you are using a shared account. To use individual functions (e.g., mark statistics as favourites, set
statistic alerts) please log in with your personal account.
If you are an admin, please authenticate by logging in again.
Learn more about how Statista can support your business.
Centraal Bureau voor de Statistiek. (October 13, 2023). Number of jobs in the Netherlands in 2022, by age (in 1,000s) [Graph]. In Statista. Retrieved June 19, 2025, from https://www.statista.com/statistics/537864/number-of-jobs-in-the-netherlands-by-age/
Centraal Bureau voor de Statistiek. "Number of jobs in the Netherlands in 2022, by age (in 1,000s)." Chart. October 13, 2023. Statista. Accessed June 19, 2025. https://www.statista.com/statistics/537864/number-of-jobs-in-the-netherlands-by-age/
Centraal Bureau voor de Statistiek. (2023). Number of jobs in the Netherlands in 2022, by age (in 1,000s). Statista. Statista Inc.. Accessed: June 19, 2025. https://www.statista.com/statistics/537864/number-of-jobs-in-the-netherlands-by-age/
Centraal Bureau voor de Statistiek. "Number of Jobs in The Netherlands in 2022, by Age (in 1,000s)." Statista, Statista Inc., 13 Oct 2023, https://www.statista.com/statistics/537864/number-of-jobs-in-the-netherlands-by-age/
Centraal Bureau voor de Statistiek, Number of jobs in the Netherlands in 2022, by age (in 1,000s) Statista, https://www.statista.com/statistics/537864/number-of-jobs-in-the-netherlands-by-age/ (last visited June 19, 2025)
Number of jobs in the Netherlands in 2022, by age (in 1,000s) [Graph], Centraal Bureau voor de Statistiek, October 13, 2023. [Online]. Available: https://www.statista.com/statistics/537864/number-of-jobs-in-the-netherlands-by-age/