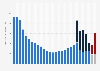
From 2008 to 2021, the share of households not able to pay unexpected expenses in Belgium ranged from 23 to 27 percent. In 2021, 23.8 percent of the households declared being unable to deal with unexpected expenses due to financial reasons.
Advertisement
Advertisement
Share of households not able to pay unexpected expenses in Belgium from 2008 to 2021
Characteristic
Share of households
2021
23.8%
2020
25.6%
2019
26.3%
2018
24.3%
2017
25.4%
2016
25.8%
2015
25.8%
2014
24%
2013
24.2%
2012
25.3%
2011
26%
2010
25.4%
2009
23.7%
Zoomable Statistic: Select the range in the chart you want to zoom in on.
23.5%24%24.5%25%25.5%26%26.5%27%
Add this content to your personal favorites. These can be accessed from the favorites menu in the main navigation.
You have no right to use this feature.
Make sure to contact us if you are interested in scientific citation.
You can upgrade your account to enable this functionality for all statistics.
This feature is not available with your current account.Request access
For the figures on material deprivation the EU-SILC (European Union - Statistics on Income and Living Conditions) survey is used. The participants are private households and the survey is taken every year and published 20 months after the interviews.
Learn more about how Statista can support your business.
Statbel. (February 23, 2022). Share of households not able to pay unexpected expenses in Belgium from 2008 to 2021 [Graph]. In Statista. Retrieved June 17, 2025, from https://www.statista.com/statistics/540022/share-of-households-not-able-to-pay-unexpected-expenses-in-belgium/
Statbel. "Share of households not able to pay unexpected expenses in Belgium from 2008 to 2021." Chart. February 23, 2022. Statista. Accessed June 17, 2025. https://www.statista.com/statistics/540022/share-of-households-not-able-to-pay-unexpected-expenses-in-belgium/
Statbel. (2022). Share of households not able to pay unexpected expenses in Belgium from 2008 to 2021. Statista. Statista Inc.. Accessed: June 17, 2025. https://www.statista.com/statistics/540022/share-of-households-not-able-to-pay-unexpected-expenses-in-belgium/
Statbel. "Share of Households Not Able to Pay Unexpected Expenses in Belgium from 2008 to 2021." Statista, Statista Inc., 23 Feb 2022, https://www.statista.com/statistics/540022/share-of-households-not-able-to-pay-unexpected-expenses-in-belgium/
Statbel, Share of households not able to pay unexpected expenses in Belgium from 2008 to 2021 Statista, https://www.statista.com/statistics/540022/share-of-households-not-able-to-pay-unexpected-expenses-in-belgium/ (last visited June 17, 2025)
Share of households not able to pay unexpected expenses in Belgium from 2008 to 2021 [Graph], Statbel, February 23, 2022. [Online]. Available: https://www.statista.com/statistics/540022/share-of-households-not-able-to-pay-unexpected-expenses-in-belgium/
Advertisement
Profit from additional features with an Employee Account
Please create an employee account to be able to mark statistics as favorites.
Then you can access your favorite statistics via the star in the header.
Profit from the additional features of your individual account
Currently, you are using a shared account. To use individual functions (e.g., mark statistics as favourites, set
statistic alerts) please log in with your personal account.
If you are an admin, please authenticate by logging in again.