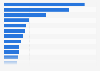
This statistic displays payment preferences for digital games in Ukraine for 2014. In 2014, 29.3 percent of transactions were made via credit or debit card.
Advertisement
Advertisement
Payment preferences of paying digital games players in Ukraine in 2014
Profit from the additional features of your individual account
Currently, you are using a shared account. To use individual functions (e.g., mark statistics as favourites, set
statistic alerts) please log in with your personal account.
If you are an admin, please authenticate by logging in again.
Learn more about how Statista can support your business.
SuperData Research. (September 9, 2014). Payment preferences of paying digital games players in Ukraine in 2014 [Graph]. In Statista. Retrieved June 17, 2025, from https://www.statista.com/statistics/542084/digital-games-payment-preferences-ukraine/
SuperData Research. "Payment preferences of paying digital games players in Ukraine in 2014." Chart. September 9, 2014. Statista. Accessed June 17, 2025. https://www.statista.com/statistics/542084/digital-games-payment-preferences-ukraine/
SuperData Research. (2014). Payment preferences of paying digital games players in Ukraine in 2014. Statista. Statista Inc.. Accessed: June 17, 2025. https://www.statista.com/statistics/542084/digital-games-payment-preferences-ukraine/
SuperData Research. "Payment Preferences of Paying Digital Games Players in Ukraine in 2014." Statista, Statista Inc., 9 Sep 2014, https://www.statista.com/statistics/542084/digital-games-payment-preferences-ukraine/
SuperData Research, Payment preferences of paying digital games players in Ukraine in 2014 Statista, https://www.statista.com/statistics/542084/digital-games-payment-preferences-ukraine/ (last visited June 17, 2025)
Payment preferences of paying digital games players in Ukraine in 2014 [Graph], SuperData Research, September 9, 2014. [Online]. Available: https://www.statista.com/statistics/542084/digital-games-payment-preferences-ukraine/