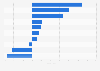
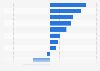
During the 52 weeks ending August 9, 2020, sales of cotton candy grapes increased by **** percent in the United States. During that period, perlette/thompson grapes witnessed a sales decline of around **** percent since the previous year.
Profit from the additional features of your individual account
Currently, you are using a shared account. To use individual functions (e.g., mark statistics as favourites, set
statistic alerts) please log in with your personal account.
If you are an admin, please authenticate by logging in again.
Learn more about how Statista can support your business.
Winsight Grocery Business. (November 1, 2020). Retail sales growth of grapes in the United States in 2020, by type [Graph]. In Statista. Retrieved July 15, 2025, from https://www.statista.com/statistics/546196/us-dollar-sales-of-grapes/
Winsight Grocery Business. "Retail sales growth of grapes in the United States in 2020, by type." Chart. November 1, 2020. Statista. Accessed July 15, 2025. https://www.statista.com/statistics/546196/us-dollar-sales-of-grapes/
Winsight Grocery Business. (2020). Retail sales growth of grapes in the United States in 2020, by type. Statista. Statista Inc.. Accessed: July 15, 2025. https://www.statista.com/statistics/546196/us-dollar-sales-of-grapes/
Winsight Grocery Business. "Retail Sales Growth of Grapes in The United States in 2020, by Type." Statista, Statista Inc., 1 Nov 2020, https://www.statista.com/statistics/546196/us-dollar-sales-of-grapes/
Winsight Grocery Business, Retail sales growth of grapes in the United States in 2020, by type Statista, https://www.statista.com/statistics/546196/us-dollar-sales-of-grapes/ (last visited July 15, 2025)
Retail sales growth of grapes in the United States in 2020, by type [Graph], Winsight Grocery Business, November 1, 2020. [Online]. Available: https://www.statista.com/statistics/546196/us-dollar-sales-of-grapes/