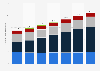
The total installed capacity of the energy distribution network in the United Kingdom (UK) amounted to approximately 35.9 gigawatts in 2022. Solar made up the largest share, with installed solar capacity reaching around 14.7 gigawatts that year.
Total installed capacity of the distribution network in the United Kingdom (UK) from 2017 to 2022, by generation type
(in megawatts)
You have no right to use this feature.
Make sure to contact us if you are interested in scientific citation.
You can upgrade your account to enable this functionality for all statistics.
This feature is not available with your current account.Request access
Learn more about how Statista can support your business.
GOV.UK, & UK Department for Business, Energy and Industrial Strategy. (July 27, 2023). Total installed capacity of the distribution network in the United Kingdom (UK) from 2017 to 2022, by generation type (in megawatts) [Graph]. In Statista. Retrieved May 07, 2025, from https://www.statista.com/statistics/547259/uk-energy-distribution-network-capacity/
GOV.UK, und UK Department for Business, Energy and Industrial Strategy. "Total installed capacity of the distribution network in the United Kingdom (UK) from 2017 to 2022, by generation type (in megawatts)." Chart. July 27, 2023. Statista. Accessed May 07, 2025. https://www.statista.com/statistics/547259/uk-energy-distribution-network-capacity/
GOV.UK, UK Department for Business, Energy and Industrial Strategy. (2023). Total installed capacity of the distribution network in the United Kingdom (UK) from 2017 to 2022, by generation type (in megawatts). Statista. Statista Inc.. Accessed: May 07, 2025. https://www.statista.com/statistics/547259/uk-energy-distribution-network-capacity/
GOV.UK, and UK Department for Business, Energy and Industrial Strategy. "Total Installed Capacity of The Distribution Network in The United Kingdom (Uk) from 2017 to 2022, by Generation Type (in Megawatts)." Statista, Statista Inc., 27 Jul 2023, https://www.statista.com/statistics/547259/uk-energy-distribution-network-capacity/
GOV.UK & UK Department for Business, Energy and Industrial Strategy, Total installed capacity of the distribution network in the United Kingdom (UK) from 2017 to 2022, by generation type (in megawatts) Statista, https://www.statista.com/statistics/547259/uk-energy-distribution-network-capacity/ (last visited May 07, 2025)
Total installed capacity of the distribution network in the United Kingdom (UK) from 2017 to 2022, by generation type (in megawatts) [Graph], GOV.UK, & UK Department for Business, Energy and Industrial Strategy, July 27, 2023. [Online]. Available: https://www.statista.com/statistics/547259/uk-energy-distribution-network-capacity/
Profit from additional features with an Employee Account
Please create an employee account to be able to mark statistics as favorites.
Then you can access your favorite statistics via the star in the header.
Profit from the additional features of your individual account
Currently, you are using a shared account. To use individual functions (e.g., mark statistics as favourites, set
statistic alerts) please log in with your personal account.
If you are an admin, please authenticate by logging in again.