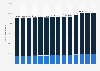
In 2021, the number of hospital employees in the health sector in the United Kingdom increased by 84,452.6 employees (+5.36 percent) since 2020. With 1,660,883.41 employees, the number of hospital employees thereby reached its highest value in the observed period. Total hospital employment includes the headcount of all people employed in a hospital structure and the number of full-time equivalents (FTE). These broad employment figures encompass general or specialty hospitals and self-employment or service contracts.
Find more key insights for the number of hospital employees in the health sector in countries like Denmark, Portugal, and Estonia.
Advertisement
Advertisement
Number of individuals employed in hospitals in the United Kingdom from 2010 to 2021*
You have no right to use this feature.
Make sure to contact us if you are interested in scientific citation.
You can upgrade your account to enable this functionality for all statistics.
This feature is not available with your current account.Request access
Learn more about how Statista can support your business.
OECD. (November 14, 2023). Number of individuals employed in hospitals in the United Kingdom from 2010 to 2021* [Graph]. In Statista. Retrieved July 26, 2025, from https://www.statista.com/statistics/554666/hospital-employment-in-united-kingdom/
OECD. "Number of individuals employed in hospitals in the United Kingdom from 2010 to 2021*." Chart. November 14, 2023. Statista. Accessed July 26, 2025. https://www.statista.com/statistics/554666/hospital-employment-in-united-kingdom/
OECD. (2023). Number of individuals employed in hospitals in the United Kingdom from 2010 to 2021*. Statista. Statista Inc.. Accessed: July 26, 2025. https://www.statista.com/statistics/554666/hospital-employment-in-united-kingdom/
OECD. "Number of Individuals Employed in Hospitals in The United Kingdom from 2010 to 2021*." Statista, Statista Inc., 14 Nov 2023, https://www.statista.com/statistics/554666/hospital-employment-in-united-kingdom/
OECD, Number of individuals employed in hospitals in the United Kingdom from 2010 to 2021* Statista, https://www.statista.com/statistics/554666/hospital-employment-in-united-kingdom/ (last visited July 26, 2025)
Number of individuals employed in hospitals in the United Kingdom from 2010 to 2021* [Graph], OECD, November 14, 2023. [Online]. Available: https://www.statista.com/statistics/554666/hospital-employment-in-united-kingdom/
Advertisement
Profit from additional features with an Employee Account
Please create an employee account to be able to mark statistics as favorites.
Then you can access your favorite statistics via the star in the header.
Profit from the additional features of your individual account
Currently, you are using a shared account. To use individual functions (e.g., mark statistics as favourites, set
statistic alerts) please log in with your personal account.
If you are an admin, please authenticate by logging in again.