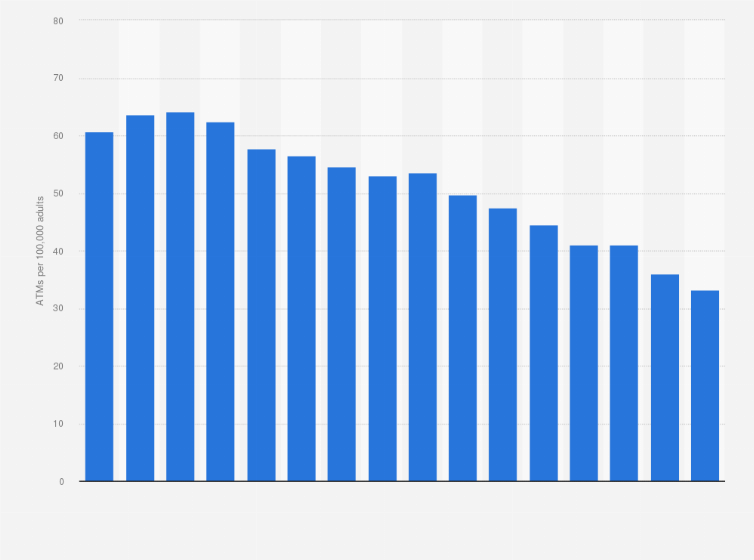
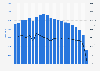
The number of automated teller machines (ATMs) in the Netherlands declined to 33.2 machines per 100,000 adults in 2021. In 2021, the number of automated teller machines thereby reached its lowest value in recent years. An ATM is an electronic banking outlet that allows customers to complete basic transactions without the aid of a branch representative or teller. ATMS allow consumers to perform quick self-service transactions such as deposits, cash withdrawals, bill pamynets, and transfers between accounts.
Find more key insights for the number of automated teller machines (ATMs) in countries like Belgium and Luxembourg.
Adjust the presentation of the statistic and data points.
Share the statistic on social media channels or embed the statistic in your
website using "Embed Code", where available.
Cite this statistic and select one of the following formats: APA, Chicago, Harvard, MLA & Bluebook.
Print the statistic including description and metadata.
Chart type
Total number of automated teller machines (ATMs) per 100,000 adults in the Netherlands from 2006 to 2021
Share this statistic
You have no right to use this feature.
Make sure to contact us if you are interested in scientific citation.
You can upgrade your account to enable this functionality for all statistics.
This feature is not available with your current account.Request access
Learn more about how Statista can support your business.
World Bank. (March 24, 2025). Total number of automated teller machines (ATMs) per 100,000 adults in the Netherlands from 2006 to 2021 [Graph]. In Statista. Retrieved June 14, 2025, from https://www.statista.com/statistics/564080/automated-teller-machines-per-100000-adults-netherlands-europe/
World Bank. "Total number of automated teller machines (ATMs) per 100,000 adults in the Netherlands from 2006 to 2021." Chart. March 24, 2025. Statista. Accessed June 14, 2025. https://www.statista.com/statistics/564080/automated-teller-machines-per-100000-adults-netherlands-europe/
World Bank. (2025). Total number of automated teller machines (ATMs) per 100,000 adults in the Netherlands from 2006 to 2021. Statista. Statista Inc.. Accessed: June 14, 2025. https://www.statista.com/statistics/564080/automated-teller-machines-per-100000-adults-netherlands-europe/
World Bank. "Total Number of Automated Teller Machines (Atms) per 100,000 Adults in The Netherlands from 2006 to 2021." Statista, Statista Inc., 24 Mar 2025, https://www.statista.com/statistics/564080/automated-teller-machines-per-100000-adults-netherlands-europe/
World Bank, Total number of automated teller machines (ATMs) per 100,000 adults in the Netherlands from 2006 to 2021 Statista, https://www.statista.com/statistics/564080/automated-teller-machines-per-100000-adults-netherlands-europe/ (last visited June 14, 2025)
Total number of automated teller machines (ATMs) per 100,000 adults in the Netherlands from 2006 to 2021 [Graph], World Bank, March 24, 2025. [Online]. Available: https://www.statista.com/statistics/564080/automated-teller-machines-per-100000-adults-netherlands-europe/
Advertisement
Profit from additional features with an Employee Account
Please create an employee account to be able to mark statistics as favorites.
Then you can access your favorite statistics via the star in the header.
Profit from the additional features of your individual account
Currently, you are using a shared account. To use individual functions (e.g., mark statistics as favourites, set
statistic alerts) please log in with your personal account.
If you are an admin, please authenticate by logging in again.