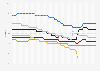
SSE's injury rate per 100,000 hours worked amounted to 0.16 percent in 2020. This was a decrease compared to four years previous, when employee and contractor's injury rate had reached 0.23 percent.
Advertisement
Advertisement
SSE plc's employee and contractor injury rate per 100,000 hours worked from 2009 to 2020
Profit from the additional features of your individual account
Currently, you are using a shared account. To use individual functions (e.g., mark statistics as favourites, set
statistic alerts) please log in with your personal account.
If you are an admin, please authenticate by logging in again.
Learn more about how Statista can support your business.
SSE. (July 6, 2020). SSE plc's employee and contractor injury rate per 100,000 hours worked from 2009 to 2020 [Graph]. In Statista. Retrieved July 05, 2025, from https://www.statista.com/statistics/566348/sse-plc-employee-injury-rate/
SSE. "SSE plc's employee and contractor injury rate per 100,000 hours worked from 2009 to 2020." Chart. July 6, 2020. Statista. Accessed July 05, 2025. https://www.statista.com/statistics/566348/sse-plc-employee-injury-rate/
SSE. (2020). SSE plc's employee and contractor injury rate per 100,000 hours worked from 2009 to 2020. Statista. Statista Inc.. Accessed: July 05, 2025. https://www.statista.com/statistics/566348/sse-plc-employee-injury-rate/
SSE. "Sse Plc's Employee and Contractor Injury Rate per 100,000 Hours Worked from 2009 to 2020." Statista, Statista Inc., 6 Jul 2020, https://www.statista.com/statistics/566348/sse-plc-employee-injury-rate/
SSE, SSE plc's employee and contractor injury rate per 100,000 hours worked from 2009 to 2020 Statista, https://www.statista.com/statistics/566348/sse-plc-employee-injury-rate/ (last visited July 05, 2025)
SSE plc's employee and contractor injury rate per 100,000 hours worked from 2009 to 2020 [Graph], SSE, July 6, 2020. [Online]. Available: https://www.statista.com/statistics/566348/sse-plc-employee-injury-rate/