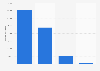
This statistic displays the value of the import and export of wine vinegar to and from the Netherlands from 2008 to 2015 (in thousand euros). It shows that in 2015, the value of the Netherlands' imports was higher than the value of the exports.
Advertisement
Advertisement
Value of the import and export of wine vinegar in the Netherlands from 2008 to 2015
(in thousand euros)
Characteristic
Import value
Export value
2015
3,744
2,324
2014
3,617
1,025
2013
3,729
1,031
2012
2,988
606
2011
3,135
524
2010
3,589
1,273
2009
2,598
2,035
2008
1,867
637
01,0002,0003,0004,0005,000
Add this content to your personal favorites. These can be accessed from the favorites menu in the main navigation.
You have no right to use this feature.
Make sure to contact us if you are interested in scientific citation.
You can upgrade your account to enable this functionality for all statistics.
This feature is not available with your current account.Request access
The source states that the import value includes shipping costs and insurance costs to the Dutch border (in the case of EU imports) or the EU border (in the case of non-EU imports). Moreover the source states imports include all goods imported for use or consumption in the Netherlands over which national taxes and import levies are paid. This includes temporarily imported goods of non-residents processed under contract in the Netherlands, goods imported from non-EU countries entering the Netherlands via warehouses and re-exports.
The source notes that the export value includes shipping costs and insurance costs to the Dutch border. Moreover the source notes the exports include goods manufactured in the Netherlands and re-exports and temporarily exported goods of residents processed under contract abroad.
Learn more about how Statista can support your business.
Centraal Bureau voor de Statistiek. (August 4, 2016). Value of the import and export of wine vinegar in the Netherlands from 2008 to 2015 (in thousand euros) [Graph]. In Statista. Retrieved June 13, 2025, from https://www.statista.com/statistics/567649/value-import-and-export-wine-vinegar-the-netherlands/
Centraal Bureau voor de Statistiek. "Value of the import and export of wine vinegar in the Netherlands from 2008 to 2015 (in thousand euros)." Chart. August 4, 2016. Statista. Accessed June 13, 2025. https://www.statista.com/statistics/567649/value-import-and-export-wine-vinegar-the-netherlands/
Centraal Bureau voor de Statistiek. (2016). Value of the import and export of wine vinegar in the Netherlands from 2008 to 2015 (in thousand euros). Statista. Statista Inc.. Accessed: June 13, 2025. https://www.statista.com/statistics/567649/value-import-and-export-wine-vinegar-the-netherlands/
Centraal Bureau voor de Statistiek. "Value of The Import and Export of Wine Vinegar in The Netherlands from 2008 to 2015 (in Thousand Euros)." Statista, Statista Inc., 4 Aug 2016, https://www.statista.com/statistics/567649/value-import-and-export-wine-vinegar-the-netherlands/
Centraal Bureau voor de Statistiek, Value of the import and export of wine vinegar in the Netherlands from 2008 to 2015 (in thousand euros) Statista, https://www.statista.com/statistics/567649/value-import-and-export-wine-vinegar-the-netherlands/ (last visited June 13, 2025)
Value of the import and export of wine vinegar in the Netherlands from 2008 to 2015 (in thousand euros) [Graph], Centraal Bureau voor de Statistiek, August 4, 2016. [Online]. Available: https://www.statista.com/statistics/567649/value-import-and-export-wine-vinegar-the-netherlands/
Advertisement
Profit from additional features with an Employee Account
Please create an employee account to be able to mark statistics as favorites.
Then you can access your favorite statistics via the star in the header.
Profit from the additional features of your individual account
Currently, you are using a shared account. To use individual functions (e.g., mark statistics as favourites, set
statistic alerts) please log in with your personal account.
If you are an admin, please authenticate by logging in again.