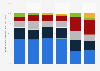
This statistic shows the result of a 2020 survey among airline passengers regarding their travel satisfaction rate, based on the stage of their journey and passenger type. The results show a 8.69 satisfaction rate among passengers using technology while on board in comparison with non-technology users who reported a 8.12 satisfaction rate.
Advertisement
Advertisement
Passenger satisfaction rate during their journey in 2019, sorted by processing steps and type of passenger
Profit from the additional features of your individual account
Currently, you are using a shared account. To use individual functions (e.g., mark statistics as favourites, set
statistic alerts) please log in with your personal account.
If you are an admin, please authenticate by logging in again.
Learn more about how Statista can support your business.
SITA. (December 7, 2020). Passenger satisfaction rate during their journey in 2019, sorted by processing steps and type of passenger [Graph]. In Statista. Retrieved June 27, 2025, from https://www.statista.com/statistics/572571/airline-passengers-travel-experience-emotions-per-phase/
SITA. "Passenger satisfaction rate during their journey in 2019, sorted by processing steps and type of passenger." Chart. December 7, 2020. Statista. Accessed June 27, 2025. https://www.statista.com/statistics/572571/airline-passengers-travel-experience-emotions-per-phase/
SITA. (2020). Passenger satisfaction rate during their journey in 2019, sorted by processing steps and type of passenger. Statista. Statista Inc.. Accessed: June 27, 2025. https://www.statista.com/statistics/572571/airline-passengers-travel-experience-emotions-per-phase/
SITA. "Passenger Satisfaction Rate during Their Journey in 2019, Sorted by Processing Steps and Type of Passenger." Statista, Statista Inc., 7 Dec 2020, https://www.statista.com/statistics/572571/airline-passengers-travel-experience-emotions-per-phase/
SITA, Passenger satisfaction rate during their journey in 2019, sorted by processing steps and type of passenger Statista, https://www.statista.com/statistics/572571/airline-passengers-travel-experience-emotions-per-phase/ (last visited June 27, 2025)
Passenger satisfaction rate during their journey in 2019, sorted by processing steps and type of passenger [Graph], SITA, December 7, 2020. [Online]. Available: https://www.statista.com/statistics/572571/airline-passengers-travel-experience-emotions-per-phase/