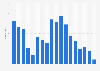
Between 2009 and 2021, more men than women were employed in the security sector in the Netherlands. In 2021, a total of 147,000 employees were counted, of which 115,000 were male and 32,000 female.
Advertisement
Advertisement
Number of employees in the security sector in the Netherlands from 2013 to 2021, by gender
(in 1,000s)
Characteristic
Male
Female
2021
115
32
2020
111
36
2019
112
32
2018
110
36
2017
108
31
2016
107
28
2015
106
28
2014
107
30
2013
115
34
0255075100125150175
Add this content to your personal favorites. These can be accessed from the favorites menu in the main navigation.
You have no right to use this feature.
Make sure to contact us if you are interested in scientific citation.
You can upgrade your account to enable this functionality for all statistics.
This feature is not available with your current account.Request access
Learn more about how Statista can support your business.
Centraal Bureau voor de Statistiek. (November 15, 2022). Number of employees in the security sector in the Netherlands from 2013 to 2021, by gender (in 1,000s) [Graph]. In Statista. Retrieved June 27, 2025, from https://www.statista.com/statistics/575215/number-of-employees-in-the-security-sector-in-the-netherlands-by-gender/
Centraal Bureau voor de Statistiek. "Number of employees in the security sector in the Netherlands from 2013 to 2021, by gender (in 1,000s)." Chart. November 15, 2022. Statista. Accessed June 27, 2025. https://www.statista.com/statistics/575215/number-of-employees-in-the-security-sector-in-the-netherlands-by-gender/
Centraal Bureau voor de Statistiek. (2022). Number of employees in the security sector in the Netherlands from 2013 to 2021, by gender (in 1,000s). Statista. Statista Inc.. Accessed: June 27, 2025. https://www.statista.com/statistics/575215/number-of-employees-in-the-security-sector-in-the-netherlands-by-gender/
Centraal Bureau voor de Statistiek. "Number of Employees in The Security Sector in The Netherlands from 2013 to 2021, by Gender (in 1,000s)." Statista, Statista Inc., 15 Nov 2022, https://www.statista.com/statistics/575215/number-of-employees-in-the-security-sector-in-the-netherlands-by-gender/
Centraal Bureau voor de Statistiek, Number of employees in the security sector in the Netherlands from 2013 to 2021, by gender (in 1,000s) Statista, https://www.statista.com/statistics/575215/number-of-employees-in-the-security-sector-in-the-netherlands-by-gender/ (last visited June 27, 2025)
Number of employees in the security sector in the Netherlands from 2013 to 2021, by gender (in 1,000s) [Graph], Centraal Bureau voor de Statistiek, November 15, 2022. [Online]. Available: https://www.statista.com/statistics/575215/number-of-employees-in-the-security-sector-in-the-netherlands-by-gender/
Advertisement
Profit from additional features with an Employee Account
Please create an employee account to be able to mark statistics as favorites.
Then you can access your favorite statistics via the star in the header.
Profit from the additional features of your individual account
Currently, you are using a shared account. To use individual functions (e.g., mark statistics as favourites, set
statistic alerts) please log in with your personal account.
If you are an admin, please authenticate by logging in again.