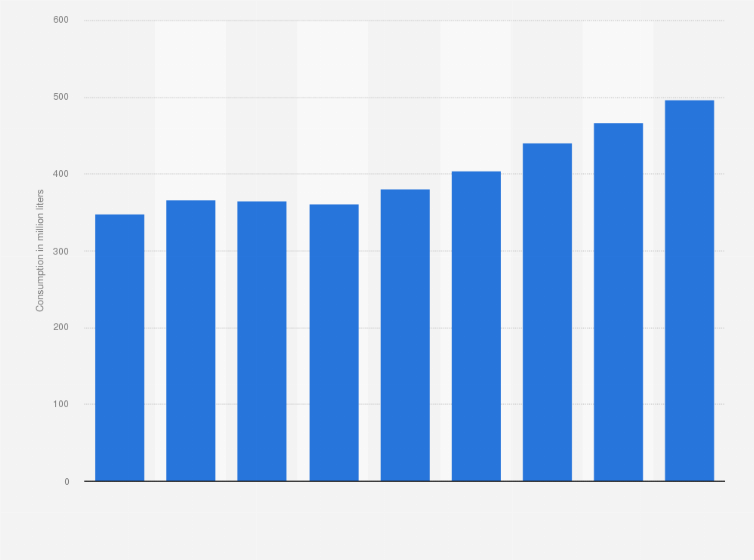
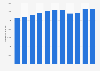
This statistic displays the consumption of non-processed waters in the Netherlands from 2010 to 2018 (in million liters). As of 2013, the Dutch consumed approximately 360 million liters of non-processed water. By 2018, this had increased to roughly 500 million liters.
Consumption of non-processed waters in the Netherlands from 2010 to 2018
(in million liters)
Adjust the presentation of the statistic and data points.
Share the statistic on social media channels or embed the statistic in your
website using "Embed Code", where available.
Cite this statistic and select one of the following formats: APA, Chicago, Harvard, MLA & Bluebook.
Print the statistic including description and metadata.
Chart type
Consumption of non-processed waters in the Netherlands from 2010 to 2018
Share this statistic
You have no right to use this feature.
Make sure to contact us if you are interested in scientific citation.
You can upgrade your account to enable this functionality for all statistics.
This feature is not available with your current account.Request access
Learn more about how Statista can support your business.
Nederlandse Vereniging Frisdranken, Waters, Sappen. (November 1, 2019). Consumption of non-processed waters in the Netherlands from 2010 to 2018 (in million liters) [Graph]. In Statista. Retrieved June 11, 2025, from https://www.statista.com/statistics/584757/consumption-of-non-processed-waters-in-the-netherlands/
Nederlandse Vereniging Frisdranken, Waters, Sappen. "Consumption of non-processed waters in the Netherlands from 2010 to 2018 (in million liters)." Chart. November 1, 2019. Statista. Accessed June 11, 2025. https://www.statista.com/statistics/584757/consumption-of-non-processed-waters-in-the-netherlands/
Nederlandse Vereniging Frisdranken, Waters, Sappen. (2019). Consumption of non-processed waters in the Netherlands from 2010 to 2018 (in million liters). Statista. Statista Inc.. Accessed: June 11, 2025. https://www.statista.com/statistics/584757/consumption-of-non-processed-waters-in-the-netherlands/
Nederlandse Vereniging Frisdranken, Waters, Sappen. "Consumption of Non-processed Waters in The Netherlands from 2010 to 2018 (in Million Liters)." Statista, Statista Inc., 1 Nov 2019, https://www.statista.com/statistics/584757/consumption-of-non-processed-waters-in-the-netherlands/
Nederlandse Vereniging Frisdranken, Waters, Sappen, Consumption of non-processed waters in the Netherlands from 2010 to 2018 (in million liters) Statista, https://www.statista.com/statistics/584757/consumption-of-non-processed-waters-in-the-netherlands/ (last visited June 11, 2025)
Consumption of non-processed waters in the Netherlands from 2010 to 2018 (in million liters) [Graph], Nederlandse Vereniging Frisdranken, Waters, Sappen, November 1, 2019. [Online]. Available: https://www.statista.com/statistics/584757/consumption-of-non-processed-waters-in-the-netherlands/
Profit from additional features with an Employee Account
Please create an employee account to be able to mark statistics as favorites.
Then you can access your favorite statistics via the star in the header.
Profit from the additional features of your individual account
Currently, you are using a shared account. To use individual functions (e.g., mark statistics as favourites, set
statistic alerts) please log in with your personal account.
If you are an admin, please authenticate by logging in again.