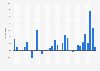
The consumer price index (CPI) of cold cuts in Norway as an annual average fluctuated from 2010 to 2020. In 2020, the average CPI of cold cuts in Norway was measured at *****, where the year 2015 equals 100.
Profit from the additional features of your individual account
Currently, you are using a shared account. To use individual functions (e.g., mark statistics as favourites, set
statistic alerts) please log in with your personal account.
If you are an admin, please authenticate by logging in again.
Learn more about how Statista can support your business.
Statistics Norway. (January 11, 2021). Consumer price index (CPI) of cold cuts in Norway from 2010 to 2020 [Graph]. In Statista. Retrieved July 13, 2025, from https://www.statista.com/statistics/585416/consumer-price-index-cpi-of-cold-cuts-in-norway/
Statistics Norway. "Consumer price index (CPI) of cold cuts in Norway from 2010 to 2020." Chart. January 11, 2021. Statista. Accessed July 13, 2025. https://www.statista.com/statistics/585416/consumer-price-index-cpi-of-cold-cuts-in-norway/
Statistics Norway. (2021). Consumer price index (CPI) of cold cuts in Norway from 2010 to 2020. Statista. Statista Inc.. Accessed: July 13, 2025. https://www.statista.com/statistics/585416/consumer-price-index-cpi-of-cold-cuts-in-norway/
Statistics Norway. "Consumer Price Index (Cpi) of Cold Cuts in Norway from 2010 to 2020." Statista, Statista Inc., 11 Jan 2021, https://www.statista.com/statistics/585416/consumer-price-index-cpi-of-cold-cuts-in-norway/
Statistics Norway, Consumer price index (CPI) of cold cuts in Norway from 2010 to 2020 Statista, https://www.statista.com/statistics/585416/consumer-price-index-cpi-of-cold-cuts-in-norway/ (last visited July 13, 2025)
Consumer price index (CPI) of cold cuts in Norway from 2010 to 2020 [Graph], Statistics Norway, January 11, 2021. [Online]. Available: https://www.statista.com/statistics/585416/consumer-price-index-cpi-of-cold-cuts-in-norway/