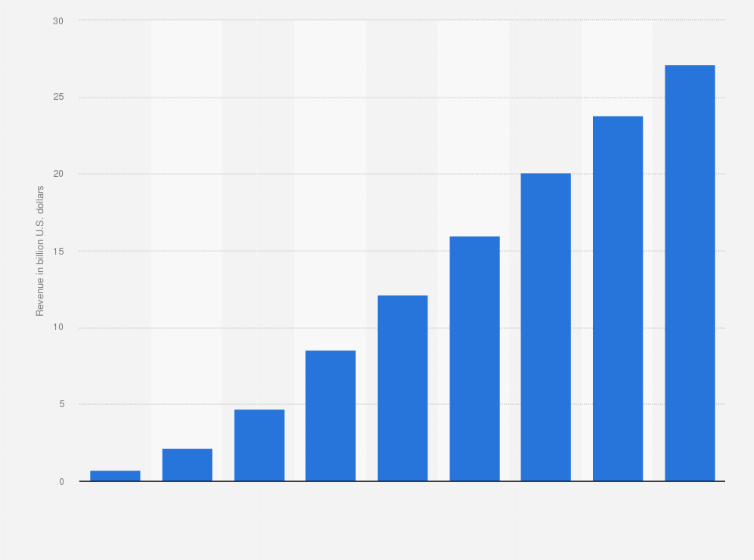
The timeline shows in-app advertising revenue in North America from 2012 to 2015 as well as a forecast thereof until 2020. The source projected that the revenue would increase from 695 million U.S. dollars in 2012 to 27.13 billion U.S. dollars in 2020.
In-app advertising revenue in North America from 2012 to 2020
(in billion U.S. dollars)
Adjust the presentation of the statistic and data points.
Share the statistic on social media channels or embed the statistic in your
website using "Embed Code", where available.
Cite this statistic and select one of the following formats: APA, Chicago, Harvard, MLA & Bluebook.
Print the statistic including description and metadata.
Chart type
In-app advertising revenue in North America from 2012 to 2020
Share this statistic
You have no right to use this feature.
Make sure to contact us if you are interested in scientific citation.
You can upgrade your account to enable this functionality for all statistics.
This feature is not available with your current account.Request access
Learn more about how Statista can support your business.
IHS. (March 15, 2016). In-app advertising revenue in North America from 2012 to 2020 (in billion U.S. dollars) [Graph]. In Statista. Retrieved May 09, 2025, from https://www.statista.com/statistics/587311/in-app-ad-revenue-north-america/
IHS. "In-app advertising revenue in North America from 2012 to 2020 (in billion U.S. dollars)." Chart. March 15, 2016. Statista. Accessed May 09, 2025. https://www.statista.com/statistics/587311/in-app-ad-revenue-north-america/
IHS. (2016). In-app advertising revenue in North America from 2012 to 2020 (in billion U.S. dollars). Statista. Statista Inc.. Accessed: May 09, 2025. https://www.statista.com/statistics/587311/in-app-ad-revenue-north-america/
IHS. "In-app Advertising Revenue in North America from 2012 to 2020 (in Billion U.S. Dollars)." Statista, Statista Inc., 15 Mar 2016, https://www.statista.com/statistics/587311/in-app-ad-revenue-north-america/
IHS, In-app advertising revenue in North America from 2012 to 2020 (in billion U.S. dollars) Statista, https://www.statista.com/statistics/587311/in-app-ad-revenue-north-america/ (last visited May 09, 2025)
In-app advertising revenue in North America from 2012 to 2020 (in billion U.S. dollars) [Graph], IHS, March 15, 2016. [Online]. Available: https://www.statista.com/statistics/587311/in-app-ad-revenue-north-america/
Profit from additional features with an Employee Account
Please create an employee account to be able to mark statistics as favorites.
Then you can access your favorite statistics via the star in the header.
Profit from the additional features of your individual account
Currently, you are using a shared account. To use individual functions (e.g., mark statistics as favourites, set
statistic alerts) please log in with your personal account.
If you are an admin, please authenticate by logging in again.