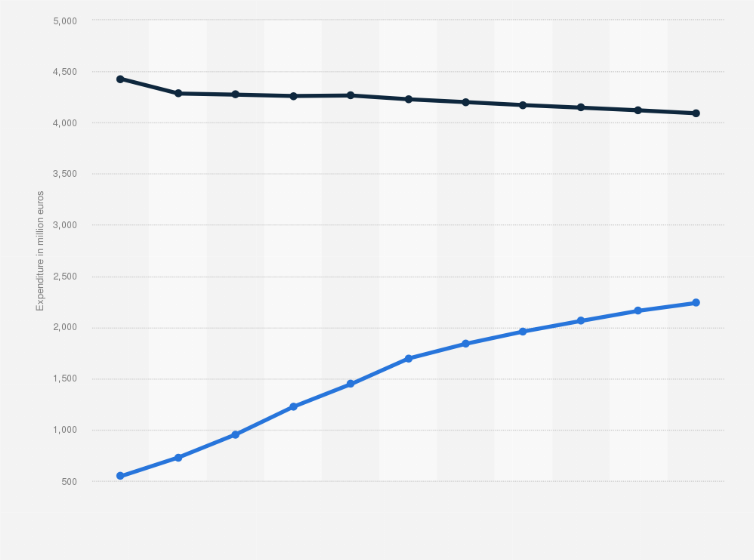
Consumer expenses in the Dutch entertainment & media (E&M) sector is expected to be over
***
Log in or register to access precise data.
billion euros by 2022, with non-digital advertising forecast to decrease. Non-digital expenses, however, are believed to be still twice as big as the digital component, despite the growing popularity of video games, esports, podcasts and live events. In 2018, non0digital consumer expenses were worth around
Digital and non-digital consumer expenses in the entertainment & media (E&M) industry in the Netherlands from 2012 to 2018, with a forecast for 2019 to 2022
(in million euros)
Adjust the presentation of the statistic and data points.
Share the statistic on social media channels or embed the statistic in your
website using "Embed Code", where available.
Cite this statistic and select one of the following formats: APA, Chicago, Harvard, MLA & Bluebook.
Print the statistic including description and metadata.
Chart type
Digital and non-digital consumer expenses in the entertainment & media (E&M) industry in the Netherlands from 2012 to 2018, with a forecast for 2019 to 2022
Share this statistic
You have no right to use this feature.
Make sure to contact us if you are interested in scientific citation.
You can upgrade your account to enable this functionality for all statistics.
This feature is not available with your current account.Request access
* the data for 2019 to 2023 is forecasted data; The figures have been taken from several publications.
Supplementary notes
The source mentions that the following segments are part of its definition of the "Media and Entertainment" industries:
revenue generated from the sale of consumer books (i.e. bought by consumers for personal use), educational books (i.e. bought by consumers or institutions for educational use) and professional books (i.e. targeted at professional users, such as legal publishing);
business-to-business (business-to-business media, comprising business information, directory advertising, trade magazines, professional books and trade shows);
cinema revenue (including box office and advertising);
accessing the Internet through either mobile Internet and fixed broadband;
spending by advertisers either through a wired Internet connection or via mobile devices;
consumer spend on music, including both physical and digital recorded music and live music played at concerts;
revenue from both circulation (consumer spend) and advertising in newspapers and consumer magazines;
the out-of-home (OOH) advertising market;
consumer spending on video accessed via an over-the-top (OTT)/streaming service (such as Netflix);
consumer spending on basic and premium pay-TV subscriptions, consumer spending on public licence fees where applicable, physical home video revenue; and on-demand video services via a TV subscription provider;
TV advertising revenue, including broadcast and online;
consumer spending on video games software and services (not hardware or devices) across both traditional and social/casual gaming, as well as revenue from advertising via video games. It also includes revenue from consumer and advertiser spend on esports;
consumer spending on VR video, VR games and VR apps.
Learn more about how Statista can support your business.
PwC. (October 17, 2019). Digital and non-digital consumer expenses in the entertainment & media (E&M) industry in the Netherlands from 2012 to 2018, with a forecast for 2019 to 2022 (in million euros) [Graph]. In Statista. Retrieved July 12, 2025, from https://www.statista.com/statistics/595807/consumer-expenditure-of-media-and-entertainment-industry-in-the-netherlands/
PwC. "Digital and non-digital consumer expenses in the entertainment & media (E&M) industry in the Netherlands from 2012 to 2018, with a forecast for 2019 to 2022 (in million euros)." Chart. October 17, 2019. Statista. Accessed July 12, 2025. https://www.statista.com/statistics/595807/consumer-expenditure-of-media-and-entertainment-industry-in-the-netherlands/
PwC. (2019). Digital and non-digital consumer expenses in the entertainment & media (E&M) industry in the Netherlands from 2012 to 2018, with a forecast for 2019 to 2022 (in million euros). Statista. Statista Inc.. Accessed: July 12, 2025. https://www.statista.com/statistics/595807/consumer-expenditure-of-media-and-entertainment-industry-in-the-netherlands/
PwC. "Digital and Non-digital Consumer Expenses in The Entertainment & Media (E&m) Industry in The Netherlands from 2012 to 2018, with a Forecast for 2019 to 2022 (in Million Euros)." Statista, Statista Inc., 17 Oct 2019, https://www.statista.com/statistics/595807/consumer-expenditure-of-media-and-entertainment-industry-in-the-netherlands/
PwC, Digital and non-digital consumer expenses in the entertainment & media (E&M) industry in the Netherlands from 2012 to 2018, with a forecast for 2019 to 2022 (in million euros) Statista, https://www.statista.com/statistics/595807/consumer-expenditure-of-media-and-entertainment-industry-in-the-netherlands/ (last visited July 12, 2025)
Digital and non-digital consumer expenses in the entertainment & media (E&M) industry in the Netherlands from 2012 to 2018, with a forecast for 2019 to 2022 (in million euros) [Graph], PwC, October 17, 2019. [Online]. Available: https://www.statista.com/statistics/595807/consumer-expenditure-of-media-and-entertainment-industry-in-the-netherlands/
Advertisement
Profit from additional features with an Employee Account
Please create an employee account to be able to mark statistics as favorites.
Then you can access your favorite statistics via the star in the header.
Profit from the additional features of your individual account
Currently, you are using a shared account. To use individual functions (e.g., mark statistics as favourites, set
statistic alerts) please log in with your personal account.
If you are an admin, please authenticate by logging in again.