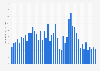
Among the ** markets with the largest class A office real estate inventory in the United States, eight experienced positive absorption rates during the fourth quarter of 2023. Dallas-Fort Worth, had the highest absorption rate at almost ******* square feet, meaning that the amount of space physically occupied was ******* square meters more than the amount of space vacated. Manhattan, the largest U.S. office market, had the second-highest absorption rate. Despite a difficult 2022, the demand in the office sector is forecast to pick up, with net absorption increasing until 2027.
Profit from the additional features of your individual account
Currently, you are using a shared account. To use individual functions (e.g., mark statistics as favourites, set
statistic alerts) please log in with your personal account.
If you are an admin, please authenticate by logging in again.
Learn more about how Statista can support your business.
Colliers International. (January 31, 2024). Absorption of office space in the United States in the 4th quarter 2023, by market (in 1,000 square feet) [Graph]. In Statista. Retrieved July 26, 2025, from https://www.statista.com/statistics/605195/office-space-absorption-rate-by-metro-area-usa/
Colliers International. "Absorption of office space in the United States in the 4th quarter 2023, by market (in 1,000 square feet)." Chart. January 31, 2024. Statista. Accessed July 26, 2025. https://www.statista.com/statistics/605195/office-space-absorption-rate-by-metro-area-usa/
Colliers International. (2024). Absorption of office space in the United States in the 4th quarter 2023, by market (in 1,000 square feet). Statista. Statista Inc.. Accessed: July 26, 2025. https://www.statista.com/statistics/605195/office-space-absorption-rate-by-metro-area-usa/
Colliers International. "Absorption of Office Space in The United States in The 4th Quarter 2023, by Market (in 1,000 Square Feet)." Statista, Statista Inc., 31 Jan 2024, https://www.statista.com/statistics/605195/office-space-absorption-rate-by-metro-area-usa/
Colliers International, Absorption of office space in the United States in the 4th quarter 2023, by market (in 1,000 square feet) Statista, https://www.statista.com/statistics/605195/office-space-absorption-rate-by-metro-area-usa/ (last visited July 26, 2025)
Absorption of office space in the United States in the 4th quarter 2023, by market (in 1,000 square feet) [Graph], Colliers International, January 31, 2024. [Online]. Available: https://www.statista.com/statistics/605195/office-space-absorption-rate-by-metro-area-usa/