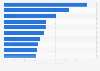
The statistic presents the box office revenue of the Mission: Impossible movie series in North America and worldwide. As of September 2019, "Mission: Impossible - Fallout", the sixth installment in the series, reached a gross of 220.16 million U.S. dollars in 3,555 cinemas across North America.
Advertisement
Advertisement
Box office revenue of the Mission: Impossible movie series in North America and worldwide as of 2018, by movie
(in million U.S. dollars)
Characteristic
North America
Worldwide
Mission: Impossible
180.98
457.7
Mission: Impossible II
215.41
546.4
Mission: Impossible III
134.03
397.9
Mission: Impossible - Ghost Protocol
209.4
694.7
Mission: Impossible - Rogue Nation
195.04
682.7
Mission: Impossible - Fallout
220.16
791.1
01002003004005006007008009001,0001,1001,200
Add this content to your personal favorites. These can be accessed from the favorites menu in the main navigation.
You have no right to use this feature.
Make sure to contact us if you are interested in scientific citation.
You can upgrade your account to enable this functionality for all statistics.
This feature is not available with your current account.Request access
Figures have been rounded. The source does not provide the publication date; the date of publication used is the the date the information was accessed.
Learn more about how Statista can support your business.
Box Office Mojo. (September 27, 2019). Box office revenue of the Mission: Impossible movie series in North America and worldwide as of 2018, by movie (in million U.S. dollars) [Graph]. In Statista. Retrieved July 14, 2025, from https://www.statista.com/statistics/608324/box-office-revenue-mission-impossible/
Box Office Mojo. "Box office revenue of the Mission: Impossible movie series in North America and worldwide as of 2018, by movie (in million U.S. dollars)." Chart. September 27, 2019. Statista. Accessed July 14, 2025. https://www.statista.com/statistics/608324/box-office-revenue-mission-impossible/
Box Office Mojo. (2019). Box office revenue of the Mission: Impossible movie series in North America and worldwide as of 2018, by movie (in million U.S. dollars). Statista. Statista Inc.. Accessed: July 14, 2025. https://www.statista.com/statistics/608324/box-office-revenue-mission-impossible/
Box Office Mojo. "Box Office Revenue of The Mission: Impossible Movie Series in North America and Worldwide as of 2018, by Movie (in Million U.S. Dollars)." Statista, Statista Inc., 27 Sep 2019, https://www.statista.com/statistics/608324/box-office-revenue-mission-impossible/
Box Office Mojo, Box office revenue of the Mission: Impossible movie series in North America and worldwide as of 2018, by movie (in million U.S. dollars) Statista, https://www.statista.com/statistics/608324/box-office-revenue-mission-impossible/ (last visited July 14, 2025)
Box office revenue of the Mission: Impossible movie series in North America and worldwide as of 2018, by movie (in million U.S. dollars) [Graph], Box Office Mojo, September 27, 2019. [Online]. Available: https://www.statista.com/statistics/608324/box-office-revenue-mission-impossible/
Advertisement
Profit from additional features with an Employee Account
Please create an employee account to be able to mark statistics as favorites.
Then you can access your favorite statistics via the star in the header.
Profit from the additional features of your individual account
Currently, you are using a shared account. To use individual functions (e.g., mark statistics as favourites, set
statistic alerts) please log in with your personal account.
If you are an admin, please authenticate by logging in again.