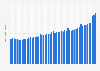
This statistic shows the number of recent immigrants in Newfoundland and Labrador, Canada, from 2000 to 2023. Between July 1, 2022 and June 30, 2023, there were 5,337 new immigrants to Newfoundland and Labrador.
Advertisement
Advertisement
Number of recent immigrants in Newfoundland and Labrador, Canada from 2000 to 2023
The time period for each year is from July 1 to June 30.
Recent immigrants are immigrants that moved to the province or territory within the reporting period.
Adapted from Statistics Canada, statcan.gc.ca, 2000 to 2023. This does not constitute an endorsement by Statistics Canada of this product.
Profit from the additional features of your individual account
Currently, you are using a shared account. To use individual functions (e.g., mark statistics as favourites, set
statistic alerts) please log in with your personal account.
If you are an admin, please authenticate by logging in again.
Learn more about how Statista can support your business.
StatCan. (September 27, 2023). Number of recent immigrants in Newfoundland and Labrador, Canada from 2000 to 2023 [Graph]. In Statista. Retrieved June 17, 2025, from https://www.statista.com/statistics/609051/number-of-immigrants-in-newfoundland-and-labrador/
StatCan. "Number of recent immigrants in Newfoundland and Labrador, Canada from 2000 to 2023." Chart. September 27, 2023. Statista. Accessed June 17, 2025. https://www.statista.com/statistics/609051/number-of-immigrants-in-newfoundland-and-labrador/
StatCan. (2023). Number of recent immigrants in Newfoundland and Labrador, Canada from 2000 to 2023. Statista. Statista Inc.. Accessed: June 17, 2025. https://www.statista.com/statistics/609051/number-of-immigrants-in-newfoundland-and-labrador/
StatCan. "Number of Recent Immigrants in Newfoundland and Labrador, Canada from 2000 to 2023." Statista, Statista Inc., 27 Sep 2023, https://www.statista.com/statistics/609051/number-of-immigrants-in-newfoundland-and-labrador/
StatCan, Number of recent immigrants in Newfoundland and Labrador, Canada from 2000 to 2023 Statista, https://www.statista.com/statistics/609051/number-of-immigrants-in-newfoundland-and-labrador/ (last visited June 17, 2025)
Number of recent immigrants in Newfoundland and Labrador, Canada from 2000 to 2023 [Graph], StatCan, September 27, 2023. [Online]. Available: https://www.statista.com/statistics/609051/number-of-immigrants-in-newfoundland-and-labrador/