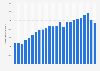
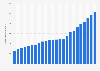
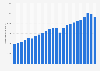
The number of direct debit payments made in Sweden grew by 23 million between 2020 and 2021. It can be seen that the number of direct debit payments fluctuated during the period observed. In 2010, the number of payments amounted to 272 million. By 2020, this had risen to over 447 million, an increase of approximately 175 million payments.
Advertisement
Advertisement
Number of direct debit transactions in Sweden from 2000 to 2021
(in millions)
All figures are provisional; The source significantly changed its database in November 2023. This may mean methodology changes, or not all EU-27 countries reporting the same figures.
Supplementary notes
The figures have been taken from several publications.
Direct debit allows for the automatic deduction of money from one's bank account in order to pay regular bills - based on a prior authorization.
Profit from the additional features of your individual account
Currently, you are using a shared account. To use individual functions (e.g., mark statistics as favourites, set
statistic alerts) please log in with your personal account.
If you are an admin, please authenticate by logging in again.
Learn more about how Statista can support your business.
ECB. (July 25, 2024). Number of direct debit transactions in Sweden from 2000 to 2021 (in millions) [Graph]. In Statista. Retrieved July 02, 2025, from https://www.statista.com/statistics/610592/number-of-direct-debit-transactions-in-sweden/
ECB. "Number of direct debit transactions in Sweden from 2000 to 2021 (in millions)." Chart. July 25, 2024. Statista. Accessed July 02, 2025. https://www.statista.com/statistics/610592/number-of-direct-debit-transactions-in-sweden/
ECB. (2024). Number of direct debit transactions in Sweden from 2000 to 2021 (in millions). Statista. Statista Inc.. Accessed: July 02, 2025. https://www.statista.com/statistics/610592/number-of-direct-debit-transactions-in-sweden/
ECB. "Number of Direct Debit Transactions in Sweden from 2000 to 2021 (in Millions)." Statista, Statista Inc., 25 Jul 2024, https://www.statista.com/statistics/610592/number-of-direct-debit-transactions-in-sweden/
ECB, Number of direct debit transactions in Sweden from 2000 to 2021 (in millions) Statista, https://www.statista.com/statistics/610592/number-of-direct-debit-transactions-in-sweden/ (last visited July 02, 2025)
Number of direct debit transactions in Sweden from 2000 to 2021 (in millions) [Graph], ECB, July 25, 2024. [Online]. Available: https://www.statista.com/statistics/610592/number-of-direct-debit-transactions-in-sweden/