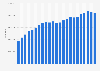
The total number of payment transactions in Sweden increased each year during the period from 2013 to 2019. The number was around 3.6 billion payment transactions in 2013, and increased to around 5.6 billion in 2019.
Advertisement
Advertisement
Total number of payment transactions in Sweden from 2013 to 2019
(in millions)
Characteristic
Number of transactions in millions
2019
5,594
2018
5,375
2017
4,990
2016
4,770
2015
4,199
2014
3,900
2013
3,604
01,0002,0003,0004,0005,0006,0007,000
Add this content to your personal favorites. These can be accessed from the favorites menu in the main navigation.
You have no right to use this feature.
Make sure to contact us if you are interested in scientific citation.
You can upgrade your account to enable this functionality for all statistics.
This feature is not available with your current account.Request access
Learn more about how Statista can support your business.
The Riksbank. (November 10, 2020). Total number of payment transactions in Sweden from 2013 to 2019 (in millions) [Graph]. In Statista. Retrieved June 14, 2025, from https://www.statista.com/statistics/611047/number-of-transactions-in-sweden/
The Riksbank. "Total number of payment transactions in Sweden from 2013 to 2019 (in millions)." Chart. November 10, 2020. Statista. Accessed June 14, 2025. https://www.statista.com/statistics/611047/number-of-transactions-in-sweden/
The Riksbank. (2020). Total number of payment transactions in Sweden from 2013 to 2019 (in millions). Statista. Statista Inc.. Accessed: June 14, 2025. https://www.statista.com/statistics/611047/number-of-transactions-in-sweden/
The Riksbank. "Total Number of Payment Transactions in Sweden from 2013 to 2019 (in Millions)." Statista, Statista Inc., 10 Nov 2020, https://www.statista.com/statistics/611047/number-of-transactions-in-sweden/
The Riksbank, Total number of payment transactions in Sweden from 2013 to 2019 (in millions) Statista, https://www.statista.com/statistics/611047/number-of-transactions-in-sweden/ (last visited June 14, 2025)
Total number of payment transactions in Sweden from 2013 to 2019 (in millions) [Graph], The Riksbank, November 10, 2020. [Online]. Available: https://www.statista.com/statistics/611047/number-of-transactions-in-sweden/
Advertisement
Profit from additional features with an Employee Account
Please create an employee account to be able to mark statistics as favorites.
Then you can access your favorite statistics via the star in the header.
Profit from the additional features of your individual account
Currently, you are using a shared account. To use individual functions (e.g., mark statistics as favourites, set
statistic alerts) please log in with your personal account.
If you are an admin, please authenticate by logging in again.