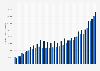
The value of payment transactions in Finland increased from 2014 to 2019. In 2019, payment transactions totaled nearly 2,803 billion euros, declining from the previous year. The value of credit transfers was roughly 2,748 billion euros in 2019, and card payments with domestic cards amounted to over 54.1 billion euros. The use of SEPA direct debits in Finland is low, and domestic direct debits have mainly been replaced by e-invoicing.
Value of payment transactions in Finland from 2014 to 2019, by type
(in billion euros)
Characteristic
Credit transfers
Card payments with domestic cards
Direct debits*
Checks**
2019
2,748.06
54.14
0.4
0.06
2018
2,823.3
51.04
0.44
0.28
2017
2,579.71
47.43
0.31
1.18
2016
2,532.59
45.8
-
2.25
2015
2,545.31
44.09
-
1.82
2014
2,307.52
42.51
2.59
6.19
05001,0001,5002,0002,5003,0003,500
Add this content to your personal favorites. These can be accessed from the favorites menu in the main navigation.
You have no right to use this feature.
Make sure to contact us if you are interested in scientific citation.
You can upgrade your account to enable this functionality for all statistics.
This feature is not available with your current account.Request access
* Finnish direct debits prior to the transition to the Single Euro Payments Area (SEPA) on February 1, 2014. With the transition to the Single Euro Payments Area (SEPA), domestic direct debits were mainly replaced by e-invoicing solutions.
** Checks cashed in Finland.
The source does not specify the date of the survey.
For this statistic, the values reported by the source have been rounded.
Learn more about how Statista can support your business.
Bank of Finland. (August 31, 2020). Value of payment transactions in Finland from 2014 to 2019, by type (in billion euros) [Graph]. In Statista. Retrieved June 11, 2025, from https://www.statista.com/statistics/611205/annual-value-of-monetary-transactions-in-finland-by-type/
Bank of Finland. "Value of payment transactions in Finland from 2014 to 2019, by type (in billion euros)." Chart. August 31, 2020. Statista. Accessed June 11, 2025. https://www.statista.com/statistics/611205/annual-value-of-monetary-transactions-in-finland-by-type/
Bank of Finland. (2020). Value of payment transactions in Finland from 2014 to 2019, by type (in billion euros). Statista. Statista Inc.. Accessed: June 11, 2025. https://www.statista.com/statistics/611205/annual-value-of-monetary-transactions-in-finland-by-type/
Bank of Finland. "Value of Payment Transactions in Finland from 2014 to 2019, by Type (in Billion Euros)." Statista, Statista Inc., 31 Aug 2020, https://www.statista.com/statistics/611205/annual-value-of-monetary-transactions-in-finland-by-type/
Bank of Finland, Value of payment transactions in Finland from 2014 to 2019, by type (in billion euros) Statista, https://www.statista.com/statistics/611205/annual-value-of-monetary-transactions-in-finland-by-type/ (last visited June 11, 2025)
Value of payment transactions in Finland from 2014 to 2019, by type (in billion euros) [Graph], Bank of Finland, August 31, 2020. [Online]. Available: https://www.statista.com/statistics/611205/annual-value-of-monetary-transactions-in-finland-by-type/
Profit from additional features with an Employee Account
Please create an employee account to be able to mark statistics as favorites.
Then you can access your favorite statistics via the star in the header.
Profit from the additional features of your individual account
Currently, you are using a shared account. To use individual functions (e.g., mark statistics as favourites, set
statistic alerts) please log in with your personal account.
If you are an admin, please authenticate by logging in again.