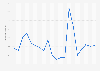
In 2023, the savings ratio of the Netherlands amounted to approximately 19 percent of their disposable income. These figures also include non-profit institutions serving households (NPISH), such as religious organizations, charity organizations, political parties, trade unions and cultural, sports and recreational organizations.
Advertisement
Advertisement
Savings ratio of disposable income of households in the Netherlands from 2000 to 2023
Characteristic
Savings ratio
2023*
19.4%
2022*
19.4%
2021*
23.3%
2020
24.9%
2019
18.3%
2018
16.3%
2017
15.7%
2016
17%
2015
16.5%
2014
16.9%
2013
15.9%
2012
15.7%
2011
14.3%
2010
13.8%
2009
15.2%
2008
11.4%
2007
9.7%
2006
9.6%
2005
9.9%
2004
11%
2003
11.2%
2002
11.2%
2001
11%
2000
9.9%
Zoomable Statistic: Select the range in the chart you want to zoom in on.
Profit from the additional features of your individual account
Currently, you are using a shared account. To use individual functions (e.g., mark statistics as favourites, set
statistic alerts) please log in with your personal account.
If you are an admin, please authenticate by logging in again.
Learn more about how Statista can support your business.
Centraal Bureau voor de Statistiek. (March 25, 2024). Savings ratio of disposable income of households in the Netherlands from 2000 to 2023 [Graph]. In Statista. Retrieved June 27, 2025, from https://www.statista.com/statistics/611937/savings-ratio-of-disposable-income-of-households-in-the-netherlands/
Centraal Bureau voor de Statistiek. "Savings ratio of disposable income of households in the Netherlands from 2000 to 2023." Chart. March 25, 2024. Statista. Accessed June 27, 2025. https://www.statista.com/statistics/611937/savings-ratio-of-disposable-income-of-households-in-the-netherlands/
Centraal Bureau voor de Statistiek. (2024). Savings ratio of disposable income of households in the Netherlands from 2000 to 2023. Statista. Statista Inc.. Accessed: June 27, 2025. https://www.statista.com/statistics/611937/savings-ratio-of-disposable-income-of-households-in-the-netherlands/
Centraal Bureau voor de Statistiek. "Savings Ratio of Disposable Income of Households in The Netherlands from 2000 to 2023." Statista, Statista Inc., 25 Mar 2024, https://www.statista.com/statistics/611937/savings-ratio-of-disposable-income-of-households-in-the-netherlands/
Centraal Bureau voor de Statistiek, Savings ratio of disposable income of households in the Netherlands from 2000 to 2023 Statista, https://www.statista.com/statistics/611937/savings-ratio-of-disposable-income-of-households-in-the-netherlands/ (last visited June 27, 2025)
Savings ratio of disposable income of households in the Netherlands from 2000 to 2023 [Graph], Centraal Bureau voor de Statistiek, March 25, 2024. [Online]. Available: https://www.statista.com/statistics/611937/savings-ratio-of-disposable-income-of-households-in-the-netherlands/