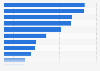
This statistic displays the average number of showers taken per person per day in the Netherlands from 2004 to 2016. In 2016, the average Dutch respondent took about 0.69 showers per day.
Advertisement
Advertisement
Average number of showers taken per person per day in the Netherlands from 2004 to 2016
Adjust the presentation of the statistic and data points.
Share the statistic on social media channels or embed the statistic in your
website using "Embed Code", where available.
Cite this statistic and select one of the following formats: APA, Chicago, Harvard, MLA & Bluebook.
Print the statistic including description and metadata.
Chart type
Average number of showers taken per person per day in the Netherlands from 2004 to 2016
Share this statistic
You have no right to use this feature.
Make sure to contact us if you are interested in scientific citation.
You can upgrade your account to enable this functionality for all statistics.
This feature is not available with your current account.Request access
The source explains that the survey consisted of three parts: an evaluation of the water using equipment at the participants' homes, a diary research in which respondents filled out on a daily basis which equipment they used and for how long, and a questionnaire about drinking water usage.
Learn more about how Statista can support your business.
Vereniging van Waterbedrijven in Nederland. (July 1, 2017). Average number of showers taken per person per day in the Netherlands from 2004 to 2016 [Graph]. In Statista. Retrieved June 15, 2025, from https://www.statista.com/statistics/616588/showering-frequency-the-netherlands/
Vereniging van Waterbedrijven in Nederland. "Average number of showers taken per person per day in the Netherlands from 2004 to 2016." Chart. July 1, 2017. Statista. Accessed June 15, 2025. https://www.statista.com/statistics/616588/showering-frequency-the-netherlands/
Vereniging van Waterbedrijven in Nederland. (2017). Average number of showers taken per person per day in the Netherlands from 2004 to 2016. Statista. Statista Inc.. Accessed: June 15, 2025. https://www.statista.com/statistics/616588/showering-frequency-the-netherlands/
Vereniging van Waterbedrijven in Nederland. "Average Number of Showers Taken per Person per Day in The Netherlands from 2004 to 2016." Statista, Statista Inc., 1 Jul 2017, https://www.statista.com/statistics/616588/showering-frequency-the-netherlands/
Vereniging van Waterbedrijven in Nederland, Average number of showers taken per person per day in the Netherlands from 2004 to 2016 Statista, https://www.statista.com/statistics/616588/showering-frequency-the-netherlands/ (last visited June 15, 2025)
Average number of showers taken per person per day in the Netherlands from 2004 to 2016 [Graph], Vereniging van Waterbedrijven in Nederland, July 1, 2017. [Online]. Available: https://www.statista.com/statistics/616588/showering-frequency-the-netherlands/
Advertisement
Profit from additional features with an Employee Account
Please create an employee account to be able to mark statistics as favorites.
Then you can access your favorite statistics via the star in the header.
Profit from the additional features of your individual account
Currently, you are using a shared account. To use individual functions (e.g., mark statistics as favourites, set
statistic alerts) please log in with your personal account.
If you are an admin, please authenticate by logging in again.