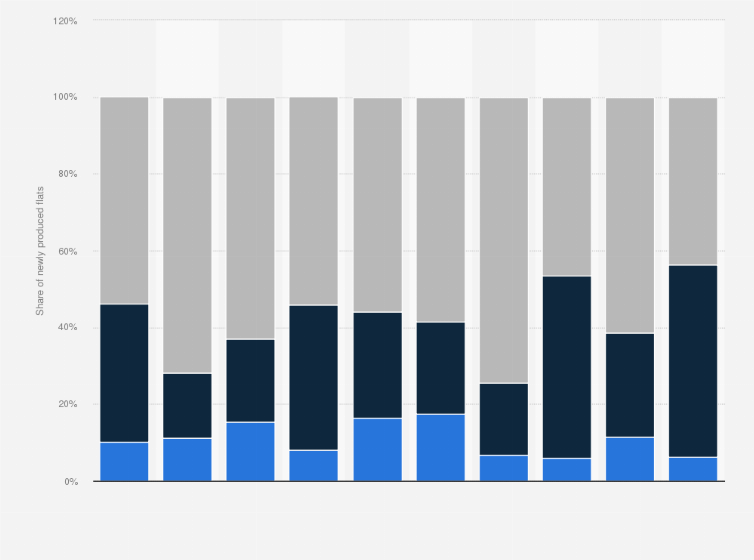
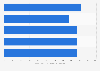
In 2023, 43.6 percent of newly produced private permanent housing in Hong Kong was located in the New Territories. Over the past years, the New Territories had been a popular location for the construction of new housing in the city.
Advertisement
Advertisement
Distribution of newly produced private permanent housing apartments in Hong Kong from 2006 to 2023, by district
Adjust the presentation of the statistic and data points.
Share the statistic on social media channels or embed the statistic in your
website using "Embed Code", where available.
Cite this statistic and select one of the following formats: APA, Chicago, Harvard, MLA & Bluebook.
Print the statistic including description and metadata.
Chart type
Distribution of newly produced private permanent housing apartments in Hong Kong from 2006 to 2023, by district
Share this statistic
You have no right to use this feature.
Make sure to contact us if you are interested in scientific citation.
You can upgrade your account to enable this functionality for all statistics.
This feature is not available with your current account.Request access
Learn more about how Statista can support your business.
Hong Kong Housing Authority. (November 15, 2024). Distribution of newly produced private permanent housing apartments in Hong Kong from 2006 to 2023, by district [Graph]. In Statista. Retrieved June 17, 2025, from https://www.statista.com/statistics/630210/hong-kong-private-permanent-housing-flat-production-distribution-by-district/
Hong Kong Housing Authority. "Distribution of newly produced private permanent housing apartments in Hong Kong from 2006 to 2023, by district." Chart. November 15, 2024. Statista. Accessed June 17, 2025. https://www.statista.com/statistics/630210/hong-kong-private-permanent-housing-flat-production-distribution-by-district/
Hong Kong Housing Authority. (2024). Distribution of newly produced private permanent housing apartments in Hong Kong from 2006 to 2023, by district. Statista. Statista Inc.. Accessed: June 17, 2025. https://www.statista.com/statistics/630210/hong-kong-private-permanent-housing-flat-production-distribution-by-district/
Hong Kong Housing Authority. "Distribution of Newly Produced Private Permanent Housing Apartments in Hong Kong from 2006 to 2023, by District." Statista, Statista Inc., 15 Nov 2024, https://www.statista.com/statistics/630210/hong-kong-private-permanent-housing-flat-production-distribution-by-district/
Hong Kong Housing Authority, Distribution of newly produced private permanent housing apartments in Hong Kong from 2006 to 2023, by district Statista, https://www.statista.com/statistics/630210/hong-kong-private-permanent-housing-flat-production-distribution-by-district/ (last visited June 17, 2025)
Distribution of newly produced private permanent housing apartments in Hong Kong from 2006 to 2023, by district [Graph], Hong Kong Housing Authority, November 15, 2024. [Online]. Available: https://www.statista.com/statistics/630210/hong-kong-private-permanent-housing-flat-production-distribution-by-district/
Advertisement
Profit from additional features with an Employee Account
Please create an employee account to be able to mark statistics as favorites.
Then you can access your favorite statistics via the star in the header.
Profit from the additional features of your individual account
Currently, you are using a shared account. To use individual functions (e.g., mark statistics as favourites, set
statistic alerts) please log in with your personal account.
If you are an admin, please authenticate by logging in again.