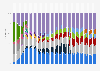
As of the first quarter of 2025, Samsung Electronics’ mobile experience (MX) was its biggest revenue generator, bringing in approximately 26 billion U.S. dollars. Other key segments are the company’s mobile communications and display panel businesses which also contributed significantly to total revenue.
Samsung
Samsung, perhaps best known for its consumer electronics division, owns business ventures that span across a large range of industries. Controlling some of the top companies operating in every sector from electronics to insurances to shipbuilding, Samsung ranks among the largest conglomerates in the world in terms of market value. The company employs hundreds of thousands of workers and accounts for a significant portion of South Korea’s GDP, meaning that Samsung is massively influential within its home country.
Mobile Communications segment
The cornerstone of Samsung’s success is its mobile communications segment, which includes various lines of smartphones and wearables as well as the company’s library of application software such as Samsung Pay. The company’s Samsung Galaxy line is among the most popular in the world and contributes towards making Samsung one of the largest smartphone brands in the world in terms of worldwide shipments.
Figures for Q1' 25 were converted based on the rate KRW= 0,00073 USD (June 2025). Figures for Q3' 24 were converted based on the rate KRW= 0,00072 USD (November 2024). Figures for Q2' 24 were converted based on the rate KRW= 0,00075 USD (September 2024). Figures for Q1 '24 were converted based on the rate KRW = 0,00073 USD (May 2024). Figures for Q4 '23 were converted based on the rate: KRW = 0.00075 USD (February 2023). Figures for 2022 and 2023 were converted based on the rate: 1 KRW = 0.00076542 USD (March 31, 2023). Figures for Q4 '20 were converted from South Korean won to U.S. dollars at the exchange rate of 1 South Korean won = 0.00092111 U.S. dollars (Dec 30, 2020). Device eXperience (DX) includes Mobile eXperience (MX)/Networks (NX) and Visual display (VD)/DA; Device Solutions (DS) includes Memory, Foundry and S.LSI; and SDC includes Large and Mobile. The source adds the following information: "The DX Division provides earnings call materials based on the business structure before the reorganization to prevent confusion and to improve understanding among investors. Harman’s sales and operating profit figures are based on Samsung Electronics’ fiscal year, and acquisition related expenses are reflected." Sales for each business unit include intersegment sales. **in 2011, Samsung categorized visual display under the Digital Media & Appliances segment and mobile communications under the Telecom segment.
Profit from the additional features of your individual account
Currently, you are using a shared account. To use individual functions (e.g., mark statistics as favourites, set
statistic alerts) please log in with your personal account.
If you are an admin, please authenticate by logging in again.
Learn more about how Statista can support your business.
Samsung, & Statista. (April 30, 2025). Samsung Electronics' revenue from 1st quarter 2011 to 1st quarter 2025, by product/business segment (in billion U.S. dollars) [Graph]. In Statista. Retrieved June 05, 2025, from https://www.statista.com/statistics/630434/samsung-quarterly-revenue-by-segment/
Samsung, und Statista. "Samsung Electronics' revenue from 1st quarter 2011 to 1st quarter 2025, by product/business segment (in billion U.S. dollars)." Chart. April 30, 2025. Statista. Accessed June 05, 2025. https://www.statista.com/statistics/630434/samsung-quarterly-revenue-by-segment/
Samsung, Statista. (2025). Samsung Electronics' revenue from 1st quarter 2011 to 1st quarter 2025, by product/business segment (in billion U.S. dollars). Statista. Statista Inc.. Accessed: June 05, 2025. https://www.statista.com/statistics/630434/samsung-quarterly-revenue-by-segment/
Samsung, and Statista. "Samsung Electronics' Revenue from 1st Quarter 2011 to 1st Quarter 2025, by Product/Business Segment (in Billion U.S. Dollars)." Statista, Statista Inc., 30 Apr 2025, https://www.statista.com/statistics/630434/samsung-quarterly-revenue-by-segment/
Samsung & Statista, Samsung Electronics' revenue from 1st quarter 2011 to 1st quarter 2025, by product/business segment (in billion U.S. dollars) Statista, https://www.statista.com/statistics/630434/samsung-quarterly-revenue-by-segment/ (last visited June 05, 2025)
Samsung Electronics' revenue from 1st quarter 2011 to 1st quarter 2025, by product/business segment (in billion U.S. dollars) [Graph], Samsung, & Statista, April 30, 2025. [Online]. Available: https://www.statista.com/statistics/630434/samsung-quarterly-revenue-by-segment/