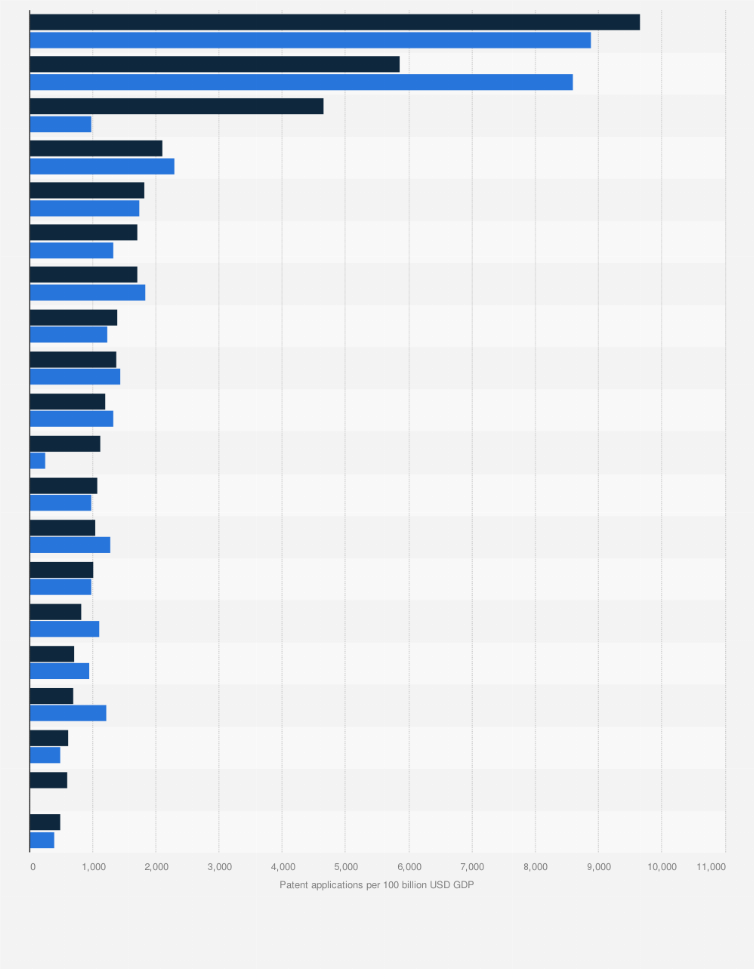
This statistic shows the number of patent applications residents from each country made per 100 billion U.S. dollars that country had in GDP in 2004 and 2014. In 2014, residents of the Republic of Korea made 9,676 patent applications per 100 billion USD of GDP.
Top 20 countries for resident patent applications per 100 billion U.S. dollars GDP in 2004 and 2014
Adjust the presentation of the statistic and data points.
Share the statistic on social media channels or embed the statistic in your
website using "Embed Code", where available.
Cite this statistic and select one of the following formats: APA, Chicago, Harvard, MLA & Bluebook.
Print the statistic including description and metadata.
Chart type
Top 20 countries for resident patent applications per 100 billion U.S. dollars GDP in 2004 and 2014
Share this statistic
You have no right to use this feature.
Make sure to contact us if you are interested in scientific citation.
You can upgrade your account to enable this functionality for all statistics.
This feature is not available with your current account.Request access
Learn more about how Statista can support your business.
WIPO. (December 14, 2015). Top 20 countries for resident patent applications per 100 billion U.S. dollars GDP in 2004 and 2014 [Graph]. In Statista. Retrieved June 05, 2025, from https://www.statista.com/statistics/632041/countries-with-highest-resident-patent-applications-to-gdp-ratio/
WIPO. "Top 20 countries for resident patent applications per 100 billion U.S. dollars GDP in 2004 and 2014." Chart. December 14, 2015. Statista. Accessed June 05, 2025. https://www.statista.com/statistics/632041/countries-with-highest-resident-patent-applications-to-gdp-ratio/
WIPO. (2015). Top 20 countries for resident patent applications per 100 billion U.S. dollars GDP in 2004 and 2014. Statista. Statista Inc.. Accessed: June 05, 2025. https://www.statista.com/statistics/632041/countries-with-highest-resident-patent-applications-to-gdp-ratio/
WIPO. "Top 20 Countries for Resident Patent Applications per 100 Billion U.S. Dollars Gdp in 2004 and 2014." Statista, Statista Inc., 14 Dec 2015, https://www.statista.com/statistics/632041/countries-with-highest-resident-patent-applications-to-gdp-ratio/
WIPO, Top 20 countries for resident patent applications per 100 billion U.S. dollars GDP in 2004 and 2014 Statista, https://www.statista.com/statistics/632041/countries-with-highest-resident-patent-applications-to-gdp-ratio/ (last visited June 05, 2025)
Top 20 countries for resident patent applications per 100 billion U.S. dollars GDP in 2004 and 2014 [Graph], WIPO, December 14, 2015. [Online]. Available: https://www.statista.com/statistics/632041/countries-with-highest-resident-patent-applications-to-gdp-ratio/
Profit from additional features with an Employee Account
Please create an employee account to be able to mark statistics as favorites.
Then you can access your favorite statistics via the star in the header.
Profit from the additional features of your individual account
Currently, you are using a shared account. To use individual functions (e.g., mark statistics as favourites, set
statistic alerts) please log in with your personal account.
If you are an admin, please authenticate by logging in again.