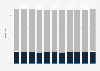
This statistic displays the Costumer preferences for communication in stores in the Netherlands in 2016. Approximately 12 percent of the respondents replied that when they leave personal data, they would like to receive information about special events.
Profit from the additional features of your individual account
Currently, you are using a shared account. To use individual functions (e.g., mark statistics as favourites, set
statistic alerts) please log in with your personal account.
If you are an admin, please authenticate by logging in again.
Learn more about how Statista can support your business.
ABN AMRO. (February 9, 2016). What do you want stores to communicate about?* [Graph]. In Statista. Retrieved June 13, 2025, from https://www.statista.com/statistics/643469/costumer-preferences-for-communication-in-stores-in-the-netherlands/
ABN AMRO. "What do you want stores to communicate about?*." Chart. February 9, 2016. Statista. Accessed June 13, 2025. https://www.statista.com/statistics/643469/costumer-preferences-for-communication-in-stores-in-the-netherlands/
ABN AMRO. (2016). What do you want stores to communicate about?*. Statista. Statista Inc.. Accessed: June 13, 2025. https://www.statista.com/statistics/643469/costumer-preferences-for-communication-in-stores-in-the-netherlands/
ABN AMRO. "What Do You Want Stores to Communicate About?*." Statista, Statista Inc., 9 Feb 2016, https://www.statista.com/statistics/643469/costumer-preferences-for-communication-in-stores-in-the-netherlands/
ABN AMRO, What do you want stores to communicate about?* Statista, https://www.statista.com/statistics/643469/costumer-preferences-for-communication-in-stores-in-the-netherlands/ (last visited June 13, 2025)
What do you want stores to communicate about?* [Graph], ABN AMRO, February 9, 2016. [Online]. Available: https://www.statista.com/statistics/643469/costumer-preferences-for-communication-in-stores-in-the-netherlands/