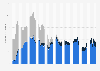
This statistic illustrates the annual value of assets held by Amec Foster Wheeler from 2011 to 2017*. In 2014, the value of the company's assets increased to more than 254 percent of the previous year's value.
Annual total assets of Amec Foster Wheeler from 2011 to 2017
(in million GBP)
Profit from the additional features of your individual account
Currently, you are using a shared account. To use individual functions (e.g., mark statistics as favourites, set
statistic alerts) please log in with your personal account.
If you are an admin, please authenticate by logging in again.
Learn more about how Statista can support your business.
Amec Foster Wheeler . (July 10, 2018). Annual total assets of Amec Foster Wheeler from 2011 to 2017 (in million GBP) [Graph]. In Statista. Retrieved May 05, 2025, from https://www.statista.com/statistics/646246/amec-foster-wheeler-total-assets/
Amec Foster Wheeler . "Annual total assets of Amec Foster Wheeler from 2011 to 2017 (in million GBP)." Chart. July 10, 2018. Statista. Accessed May 05, 2025. https://www.statista.com/statistics/646246/amec-foster-wheeler-total-assets/
Amec Foster Wheeler . (2018). Annual total assets of Amec Foster Wheeler from 2011 to 2017 (in million GBP). Statista. Statista Inc.. Accessed: May 05, 2025. https://www.statista.com/statistics/646246/amec-foster-wheeler-total-assets/
Amec Foster Wheeler . "Annual Total Assets of Amec Foster Wheeler from 2011 to 2017 (in Million Gbp)." Statista, Statista Inc., 10 Jul 2018, https://www.statista.com/statistics/646246/amec-foster-wheeler-total-assets/
Amec Foster Wheeler , Annual total assets of Amec Foster Wheeler from 2011 to 2017 (in million GBP) Statista, https://www.statista.com/statistics/646246/amec-foster-wheeler-total-assets/ (last visited May 05, 2025)
Annual total assets of Amec Foster Wheeler from 2011 to 2017 (in million GBP) [Graph], Amec Foster Wheeler , July 10, 2018. [Online]. Available: https://www.statista.com/statistics/646246/amec-foster-wheeler-total-assets/