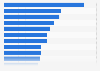
In 2023, approximately 8.63 library visits were made per inhabitant in Finland. Physical library visits decreased significantly between 2020 and 2022 due to the COVID-19 restrictions. In the period from 2013 to 2019, the average number of library visits fluctuated annually between ten and nine per inhabitant.
Advertisement
Advertisement
Average number of physical library visits in Finland from 2013 to 2023, per inhabitant
Characteristic
Number of library visists per inhabitant
2023
8.63
2022
7.44
2021
5.85
2020
6.41
2019
9.78
2018
9.09
2017
9.15
2016
8.99
2015
9.07
2014
9.29
2013
9.5
024681012
Add this content to your personal favorites. These can be accessed from the favorites menu in the main navigation.
You have no right to use this feature.
Make sure to contact us if you are interested in scientific citation.
You can upgrade your account to enable this functionality for all statistics.
This feature is not available with your current account.Request access
The source adds the following information: "All the public libraries in Finland (except in the Åland Islands) and the Regional State Administrative Agencies take part in the production of the statistical information."
Learn more about how Statista can support your business.
Kirjastot.fi. (June 18, 2024). Average number of physical library visits in Finland from 2013 to 2023, per inhabitant [Graph]. In Statista. Retrieved June 15, 2025, from https://www.statista.com/statistics/650606/finland-average-number-of-library-visits-per-inhabitant/
Kirjastot.fi. "Average number of physical library visits in Finland from 2013 to 2023, per inhabitant." Chart. June 18, 2024. Statista. Accessed June 15, 2025. https://www.statista.com/statistics/650606/finland-average-number-of-library-visits-per-inhabitant/
Kirjastot.fi. (2024). Average number of physical library visits in Finland from 2013 to 2023, per inhabitant. Statista. Statista Inc.. Accessed: June 15, 2025. https://www.statista.com/statistics/650606/finland-average-number-of-library-visits-per-inhabitant/
Kirjastot.fi. "Average Number of Physical Library Visits in Finland from 2013 to 2023, per Inhabitant." Statista, Statista Inc., 18 Jun 2024, https://www.statista.com/statistics/650606/finland-average-number-of-library-visits-per-inhabitant/
Kirjastot.fi, Average number of physical library visits in Finland from 2013 to 2023, per inhabitant Statista, https://www.statista.com/statistics/650606/finland-average-number-of-library-visits-per-inhabitant/ (last visited June 15, 2025)
Average number of physical library visits in Finland from 2013 to 2023, per inhabitant [Graph], Kirjastot.fi, June 18, 2024. [Online]. Available: https://www.statista.com/statistics/650606/finland-average-number-of-library-visits-per-inhabitant/
Advertisement
Profit from additional features with an Employee Account
Please create an employee account to be able to mark statistics as favorites.
Then you can access your favorite statistics via the star in the header.
Profit from the additional features of your individual account
Currently, you are using a shared account. To use individual functions (e.g., mark statistics as favourites, set
statistic alerts) please log in with your personal account.
If you are an admin, please authenticate by logging in again.