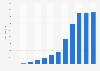
This statistic displays the average number of serves of discretionary foods consumed per week in the Australian Capital Territory in 2015/2016, by type of food. That year, respondents from the Australian Capital Territory consumed on average about one serve of muesli and snack bars per week in Australia.
Advertisement
Advertisement
Average number of serves of discretionary foods consumed per week in the Australian Capital Territory in 2015/2016, by type of food
Profit from the additional features of your individual account
Currently, you are using a shared account. To use individual functions (e.g., mark statistics as favourites, set
statistic alerts) please log in with your personal account.
If you are an admin, please authenticate by logging in again.
Learn more about how Statista can support your business.
CSIRO. (September 25, 2016). Average number of serves of discretionary foods consumed per week in the Australian Capital Territory in 2015/2016, by type of food [Graph]. In Statista. Retrieved June 22, 2025, from https://www.statista.com/statistics/653279/australia-weekly-processed-food-intake-in-act/
CSIRO. "Average number of serves of discretionary foods consumed per week in the Australian Capital Territory in 2015/2016, by type of food." Chart. September 25, 2016. Statista. Accessed June 22, 2025. https://www.statista.com/statistics/653279/australia-weekly-processed-food-intake-in-act/
CSIRO. (2016). Average number of serves of discretionary foods consumed per week in the Australian Capital Territory in 2015/2016, by type of food. Statista. Statista Inc.. Accessed: June 22, 2025. https://www.statista.com/statistics/653279/australia-weekly-processed-food-intake-in-act/
CSIRO. "Average Number of Serves of Discretionary Foods Consumed per Week in The Australian Capital Territory in 2015/2016, by Type of Food." Statista, Statista Inc., 25 Sep 2016, https://www.statista.com/statistics/653279/australia-weekly-processed-food-intake-in-act/
CSIRO, Average number of serves of discretionary foods consumed per week in the Australian Capital Territory in 2015/2016, by type of food Statista, https://www.statista.com/statistics/653279/australia-weekly-processed-food-intake-in-act/ (last visited June 22, 2025)
Average number of serves of discretionary foods consumed per week in the Australian Capital Territory in 2015/2016, by type of food [Graph], CSIRO, September 25, 2016. [Online]. Available: https://www.statista.com/statistics/653279/australia-weekly-processed-food-intake-in-act/