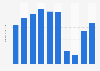
The performing arts industry's revenue in the Netherlands bounced back in 2022, following a sharp decline due to the impact of the COVID-19 pandemic. After declining to under 147 million euros in 2021, this industry's revenue reached nearly 508 million euros in 2022, but remained below the figure from 2019.
Total revenue of the performing arts industry in the Netherlands from 2008 to 2022
(in million euros)
Characteristic
Total revenue in million euros
2022¹
507.83
2021¹
146.69
2020¹
178.51
2019¹
536.36
2018¹
494.99
2017¹
485.57
2016¹
484.41
2015
465.62
2014
434.39
2013
427.1
2012
381.16
2011
409.6
2010
401.23
0100200300400500600
Add this content to your personal favorites. These can be accessed from the favorites menu in the main navigation.
You have no right to use this feature.
Make sure to contact us if you are interested in scientific citation.
You can upgrade your account to enable this functionality for all statistics.
This feature is not available with your current account.Request access
Figures have been rounded. Performing arts refer to artistic productions like theaters, pop concerts, or musicals performed in front of a general audience by professional artists.
Learn more about how Statista can support your business.
Centraal Bureau voor de Statistiek. (December 22, 2023). Total revenue of the performing arts industry in the Netherlands from 2008 to 2022 (in million euros) [Graph]. In Statista. Retrieved May 07, 2025, from https://www.statista.com/statistics/659630/total-revenue-of-the-performing-arts-industry-in-the-netherlands/
Centraal Bureau voor de Statistiek. "Total revenue of the performing arts industry in the Netherlands from 2008 to 2022 (in million euros)." Chart. December 22, 2023. Statista. Accessed May 07, 2025. https://www.statista.com/statistics/659630/total-revenue-of-the-performing-arts-industry-in-the-netherlands/
Centraal Bureau voor de Statistiek. (2023). Total revenue of the performing arts industry in the Netherlands from 2008 to 2022 (in million euros). Statista. Statista Inc.. Accessed: May 07, 2025. https://www.statista.com/statistics/659630/total-revenue-of-the-performing-arts-industry-in-the-netherlands/
Centraal Bureau voor de Statistiek. "Total Revenue of The Performing Arts Industry in The Netherlands from 2008 to 2022 (in Million Euros)." Statista, Statista Inc., 22 Dec 2023, https://www.statista.com/statistics/659630/total-revenue-of-the-performing-arts-industry-in-the-netherlands/
Centraal Bureau voor de Statistiek, Total revenue of the performing arts industry in the Netherlands from 2008 to 2022 (in million euros) Statista, https://www.statista.com/statistics/659630/total-revenue-of-the-performing-arts-industry-in-the-netherlands/ (last visited May 07, 2025)
Total revenue of the performing arts industry in the Netherlands from 2008 to 2022 (in million euros) [Graph], Centraal Bureau voor de Statistiek, December 22, 2023. [Online]. Available: https://www.statista.com/statistics/659630/total-revenue-of-the-performing-arts-industry-in-the-netherlands/
Profit from additional features with an Employee Account
Please create an employee account to be able to mark statistics as favorites.
Then you can access your favorite statistics via the star in the header.
Profit from the additional features of your individual account
Currently, you are using a shared account. To use individual functions (e.g., mark statistics as favourites, set
statistic alerts) please log in with your personal account.
If you are an admin, please authenticate by logging in again.