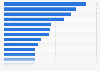
The performing arts industry's revenue in the Netherlands bounced back in 2022, following a sharp decline due to the impact of the COVID-19 pandemic. Despite the significant annual increase, this industry's revenue remained below the figure from 2019, totaling nearly 508 million euros in 2022. That year, public-related income accounted for the highest earnings, amounting to over 321 million euros.
Total revenue of the performing arts industry in the Netherlands from 2016 to 2022, by type
(in 1,000 euros)
Characteristic
Public-related income
Catering, lease income
Rental for non-theatrical events
Sponsorship income
2022¹
321,177
121,049
48,990
16,613
2021¹
84,940
26,710
22,788
12,248
2020¹
111,559
33,846
19,847
13,259
2019¹
337,636
129,154
52,889
13,890
2018¹
319,741
112,365
49,381
13,499
2017¹
310,496
112,581
49,240
13,256
2016¹
304,487
113,813
48,911
17,199
0100,000200,000300,000400,000500,000600,000
Add this content to your personal favorites. These can be accessed from the favorites menu in the main navigation.
You have no right to use this feature.
Make sure to contact us if you are interested in scientific citation.
You can upgrade your account to enable this functionality for all statistics.
This feature is not available with your current account.Request access
Public-related income includes: revenue from receipts, reservation money, theater allowances, income from wardrobe, merchandising, etc., rental for theatrical events.
Rental for non theatrical-events includes: revenue from receptions, conferences, and meetings.
Performing arts refer to artistic productions like theaters, pop concerts, or musicals performed in front of a general audience by professional artists.
Learn more about how Statista can support your business.
Centraal Bureau voor de Statistiek. (December 22, 2023). Total revenue of the performing arts industry in the Netherlands from 2016 to 2022, by type (in 1,000 euros) [Graph]. In Statista. Retrieved May 11, 2025, from https://www.statista.com/statistics/660064/total-revenue-of-the-performing-arts-industry-netherlands-by-category/
Centraal Bureau voor de Statistiek. "Total revenue of the performing arts industry in the Netherlands from 2016 to 2022, by type (in 1,000 euros)." Chart. December 22, 2023. Statista. Accessed May 11, 2025. https://www.statista.com/statistics/660064/total-revenue-of-the-performing-arts-industry-netherlands-by-category/
Centraal Bureau voor de Statistiek. (2023). Total revenue of the performing arts industry in the Netherlands from 2016 to 2022, by type (in 1,000 euros). Statista. Statista Inc.. Accessed: May 11, 2025. https://www.statista.com/statistics/660064/total-revenue-of-the-performing-arts-industry-netherlands-by-category/
Centraal Bureau voor de Statistiek. "Total Revenue of The Performing Arts Industry in The Netherlands from 2016 to 2022, by Type (in 1,000 Euros)." Statista, Statista Inc., 22 Dec 2023, https://www.statista.com/statistics/660064/total-revenue-of-the-performing-arts-industry-netherlands-by-category/
Centraal Bureau voor de Statistiek, Total revenue of the performing arts industry in the Netherlands from 2016 to 2022, by type (in 1,000 euros) Statista, https://www.statista.com/statistics/660064/total-revenue-of-the-performing-arts-industry-netherlands-by-category/ (last visited May 11, 2025)
Total revenue of the performing arts industry in the Netherlands from 2016 to 2022, by type (in 1,000 euros) [Graph], Centraal Bureau voor de Statistiek, December 22, 2023. [Online]. Available: https://www.statista.com/statistics/660064/total-revenue-of-the-performing-arts-industry-netherlands-by-category/
Profit from additional features with an Employee Account
Please create an employee account to be able to mark statistics as favorites.
Then you can access your favorite statistics via the star in the header.
Profit from the additional features of your individual account
Currently, you are using a shared account. To use individual functions (e.g., mark statistics as favourites, set
statistic alerts) please log in with your personal account.
If you are an admin, please authenticate by logging in again.