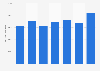
In 2024, the sales volume of fruit juices in Japan amounted to *** million cases, a decrease from ***** million cases in 2015. The Japanese non-alcoholic beverage market is dominated by the significance of ready-to-drink (RTD) tea and coffee, relegating fruit juices and fruit beverages to a secondary position.
Profit from the additional features of your individual account
Currently, you are using a shared account. To use individual functions (e.g., mark statistics as favourites, set
statistic alerts) please log in with your personal account.
If you are an admin, please authenticate by logging in again.
Learn more about how Statista can support your business.
Asahi. (February 14, 2025). Sales volume of fruit juices in Japan from 2015 to 2024 (in million cases) [Graph]. In Statista. Retrieved July 05, 2025, from https://www.statista.com/statistics/661399/japan-fruit-juices-retail-sales-volume/
Asahi. "Sales volume of fruit juices in Japan from 2015 to 2024 (in million cases)." Chart. February 14, 2025. Statista. Accessed July 05, 2025. https://www.statista.com/statistics/661399/japan-fruit-juices-retail-sales-volume/
Asahi. (2025). Sales volume of fruit juices in Japan from 2015 to 2024 (in million cases). Statista. Statista Inc.. Accessed: July 05, 2025. https://www.statista.com/statistics/661399/japan-fruit-juices-retail-sales-volume/
Asahi. "Sales Volume of Fruit Juices in Japan from 2015 to 2024 (in Million Cases)." Statista, Statista Inc., 14 Feb 2025, https://www.statista.com/statistics/661399/japan-fruit-juices-retail-sales-volume/
Asahi, Sales volume of fruit juices in Japan from 2015 to 2024 (in million cases) Statista, https://www.statista.com/statistics/661399/japan-fruit-juices-retail-sales-volume/ (last visited July 05, 2025)
Sales volume of fruit juices in Japan from 2015 to 2024 (in million cases) [Graph], Asahi, February 14, 2025. [Online]. Available: https://www.statista.com/statistics/661399/japan-fruit-juices-retail-sales-volume/