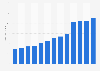
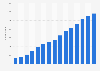
This statistic presents the total transaction value of European biopharmaceutical company M&A deals from 2009 to 2022. The total transaction value of European biopharma company M&As in 2022 reached some 6.2 billion U.S. dollars, one of the lowest amounts in the provided time interval.
Total transaction value of completed European biopharmaceutical company M&A deals from 2009 to 2022
(in million U.S. dollars)
Characteristic
Value in billion U.S. dollars
2022
6,155
2021
29,347
2020
8,232
2019
13,845
2018
98,007
2017
44,900
2016
23,707
2015
61,439
2014
46,599
2013
25,487
2012
11,232
2011
19,260
2010
10,978
020,00040,00060,00080,000100,000120,000
Add this content to your personal favorites. These can be accessed from the favorites menu in the main navigation.
You have no right to use this feature.
Make sure to contact us if you are interested in scientific citation.
You can upgrade your account to enable this functionality for all statistics.
This feature is not available with your current account.Request access
The statistic includes announced (and subsequently completed) trade sales of biotechnology and pharma companies with a therapeutic focus (Rx incl. generics as well as OTC), where the targeted region was Europe.
Learn more about how Statista can support your business.
HBM Partners. (December 31, 2023). Total transaction value of completed European biopharmaceutical company M&A deals from 2009 to 2022 (in million U.S. dollars) [Graph]. In Statista. Retrieved May 16, 2025, from https://www.statista.com/statistics/667897/biopharma-company-trade-sales-european-union-eu/
HBM Partners. "Total transaction value of completed European biopharmaceutical company M&A deals from 2009 to 2022 (in million U.S. dollars)." Chart. December 31, 2023. Statista. Accessed May 16, 2025. https://www.statista.com/statistics/667897/biopharma-company-trade-sales-european-union-eu/
HBM Partners. (2023). Total transaction value of completed European biopharmaceutical company M&A deals from 2009 to 2022 (in million U.S. dollars). Statista. Statista Inc.. Accessed: May 16, 2025. https://www.statista.com/statistics/667897/biopharma-company-trade-sales-european-union-eu/
HBM Partners. "Total Transaction Value of Completed European Biopharmaceutical Company M&a Deals from 2009 to 2022 (in Million U.S. Dollars)." Statista, Statista Inc., 31 Dec 2023, https://www.statista.com/statistics/667897/biopharma-company-trade-sales-european-union-eu/
HBM Partners, Total transaction value of completed European biopharmaceutical company M&A deals from 2009 to 2022 (in million U.S. dollars) Statista, https://www.statista.com/statistics/667897/biopharma-company-trade-sales-european-union-eu/ (last visited May 16, 2025)
Total transaction value of completed European biopharmaceutical company M&A deals from 2009 to 2022 (in million U.S. dollars) [Graph], HBM Partners, December 31, 2023. [Online]. Available: https://www.statista.com/statistics/667897/biopharma-company-trade-sales-european-union-eu/
Profit from additional features with an Employee Account
Please create an employee account to be able to mark statistics as favorites.
Then you can access your favorite statistics via the star in the header.
Profit from the additional features of your individual account
Currently, you are using a shared account. To use individual functions (e.g., mark statistics as favourites, set
statistic alerts) please log in with your personal account.
If you are an admin, please authenticate by logging in again.