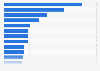
The statistic presents the distribution of traffic sources for top news stories in the United States as of February 2017. According to the source, 10 percent of the traffic for online news was generated through social media.
Advertisement
Advertisement
Distribution of traffic sources for top online news stories in the United States in 2017
Profit from the additional features of your individual account
Currently, you are using a shared account. To use individual functions (e.g., mark statistics as favourites, set
statistic alerts) please log in with your personal account.
If you are an admin, please authenticate by logging in again.
Learn more about how Statista can support your business.
Visual Capitalist. (February 10, 2017). Distribution of traffic sources for top online news stories in the United States in 2017 [Graph]. In Statista. Retrieved June 17, 2025, from https://www.statista.com/statistics/672285/news-traffic-source/
Visual Capitalist. "Distribution of traffic sources for top online news stories in the United States in 2017." Chart. February 10, 2017. Statista. Accessed June 17, 2025. https://www.statista.com/statistics/672285/news-traffic-source/
Visual Capitalist. (2017). Distribution of traffic sources for top online news stories in the United States in 2017. Statista. Statista Inc.. Accessed: June 17, 2025. https://www.statista.com/statistics/672285/news-traffic-source/
Visual Capitalist. "Distribution of Traffic Sources for Top Online News Stories in The United States in 2017." Statista, Statista Inc., 10 Feb 2017, https://www.statista.com/statistics/672285/news-traffic-source/
Visual Capitalist, Distribution of traffic sources for top online news stories in the United States in 2017 Statista, https://www.statista.com/statistics/672285/news-traffic-source/ (last visited June 17, 2025)
Distribution of traffic sources for top online news stories in the United States in 2017 [Graph], Visual Capitalist, February 10, 2017. [Online]. Available: https://www.statista.com/statistics/672285/news-traffic-source/