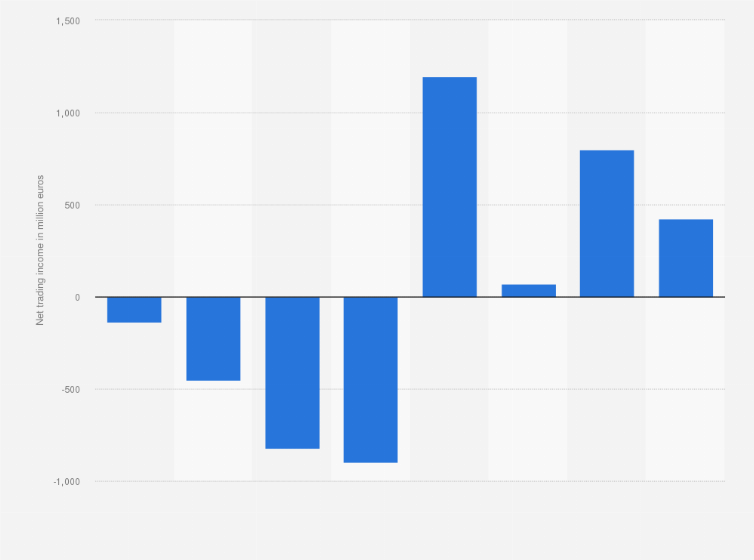
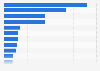
The total net trading income in foreign exchange transactions of ING Group fluctuated considerably between 2013 and 2020. The Internationale Nederlanden Groep (ING Group) is a global bank and financial services company headquartered in Amsterdam, the Netherlands. In 2020, the total net trading income in foreign exchange transactions was worth approximately 422 million euros, a significant decrease compared to the previous year. Their total net trading income in foreign exchange transactions amounted to approximately -138 million euros in 2013, so there has been an overall increase during this time period.
Total net trading income in foreign exchange transactions of ING Group from 2013 to 2020
(in million euros)
Adjust the presentation of the statistic and data points.
Share the statistic on social media channels or embed the statistic in your
website using "Embed Code", where available.
Cite this statistic and select one of the following formats: APA, Chicago, Harvard, MLA & Bluebook.
Print the statistic including description and metadata.
Chart type
Total net trading income in foreign exchange transactions of ING Group from 2013 to 2020
Share this statistic
You have no right to use this feature.
Make sure to contact us if you are interested in scientific citation.
You can upgrade your account to enable this functionality for all statistics.
This feature is not available with your current account.Request access
The source states:
"Foreign exchange transactions results include gains and losses from spot and forward contracts, options, futures, and translated foreign currency assets and liabilities. The result on currency trading is included in foreign exchange transactions results."
The figures have been taken from several publications.
Learn more about how Statista can support your business.
ING. (March 11, 2021). Total net trading income in foreign exchange transactions of ING Group from 2013 to 2020 (in million euros) [Graph]. In Statista. Retrieved May 25, 2025, from https://www.statista.com/statistics/678365/net-trading-income-in-foreign-exchange-transactions-of-ing-group/
ING. "Total net trading income in foreign exchange transactions of ING Group from 2013 to 2020 (in million euros)." Chart. March 11, 2021. Statista. Accessed May 25, 2025. https://www.statista.com/statistics/678365/net-trading-income-in-foreign-exchange-transactions-of-ing-group/
ING. (2021). Total net trading income in foreign exchange transactions of ING Group from 2013 to 2020 (in million euros). Statista. Statista Inc.. Accessed: May 25, 2025. https://www.statista.com/statistics/678365/net-trading-income-in-foreign-exchange-transactions-of-ing-group/
ING. "Total Net Trading Income in Foreign Exchange Transactions of Ing Group from 2013 to 2020 (in Million Euros)." Statista, Statista Inc., 11 Mar 2021, https://www.statista.com/statistics/678365/net-trading-income-in-foreign-exchange-transactions-of-ing-group/
ING, Total net trading income in foreign exchange transactions of ING Group from 2013 to 2020 (in million euros) Statista, https://www.statista.com/statistics/678365/net-trading-income-in-foreign-exchange-transactions-of-ing-group/ (last visited May 25, 2025)
Total net trading income in foreign exchange transactions of ING Group from 2013 to 2020 (in million euros) [Graph], ING, March 11, 2021. [Online]. Available: https://www.statista.com/statistics/678365/net-trading-income-in-foreign-exchange-transactions-of-ing-group/
Profit from additional features with an Employee Account
Please create an employee account to be able to mark statistics as favorites.
Then you can access your favorite statistics via the star in the header.
Profit from the additional features of your individual account
Currently, you are using a shared account. To use individual functions (e.g., mark statistics as favourites, set
statistic alerts) please log in with your personal account.
If you are an admin, please authenticate by logging in again.