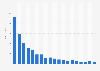
In 2024, the sales of IT devices manufactured by LG Display accounted for about **** percent of all sales. Mobile devices consist of panels for monitor, etc. The sales share of mobile devices decreased compared to the year before.
Profit from the additional features of your individual account
Currently, you are using a shared account. To use individual functions (e.g., mark statistics as favourites, set
statistic alerts) please log in with your personal account.
If you are an admin, please authenticate by logging in again.
Learn more about how Statista can support your business.
DART. (March 12, 2025). Revenue distribution of LG Display revenue from 2015 to 2024, by category [Graph]. In Statista. Retrieved June 27, 2025, from https://www.statista.com/statistics/679858/lg-display-sales-revenue-south-korea-category/
DART. "Revenue distribution of LG Display revenue from 2015 to 2024, by category." Chart. March 12, 2025. Statista. Accessed June 27, 2025. https://www.statista.com/statistics/679858/lg-display-sales-revenue-south-korea-category/
DART. (2025). Revenue distribution of LG Display revenue from 2015 to 2024, by category. Statista. Statista Inc.. Accessed: June 27, 2025. https://www.statista.com/statistics/679858/lg-display-sales-revenue-south-korea-category/
DART. "Revenue Distribution of Lg Display Revenue from 2015 to 2024, by Category." Statista, Statista Inc., 12 Mar 2025, https://www.statista.com/statistics/679858/lg-display-sales-revenue-south-korea-category/
DART, Revenue distribution of LG Display revenue from 2015 to 2024, by category Statista, https://www.statista.com/statistics/679858/lg-display-sales-revenue-south-korea-category/ (last visited June 27, 2025)
Revenue distribution of LG Display revenue from 2015 to 2024, by category [Graph], DART, March 12, 2025. [Online]. Available: https://www.statista.com/statistics/679858/lg-display-sales-revenue-south-korea-category/