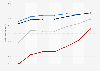
The timeline shows the total time spent on mobile apps and websites by smartphone users in the United States from June 2016 to December 2016, sorted by channel. In December 2016, U.S. smartphone users spent a total of 6.9 billion hours accessing online content via mobile apps.
Profit from the additional features of your individual account
Currently, you are using a shared account. To use individual functions (e.g., mark statistics as favourites, set
statistic alerts) please log in with your personal account.
If you are an admin, please authenticate by logging in again.
Learn more about how Statista can support your business.
Verto Analytics. (February 21, 2017). Total time spent on mobile apps and websites by smartphone users in the United States from June 2016 to December 2016, by channel (in billion hours) [Graph]. In Statista. Retrieved June 17, 2025, from https://www.statista.com/statistics/681174/us-monthly-smartphone-app-website-time/
Verto Analytics. "Total time spent on mobile apps and websites by smartphone users in the United States from June 2016 to December 2016, by channel (in billion hours)." Chart. February 21, 2017. Statista. Accessed June 17, 2025. https://www.statista.com/statistics/681174/us-monthly-smartphone-app-website-time/
Verto Analytics. (2017). Total time spent on mobile apps and websites by smartphone users in the United States from June 2016 to December 2016, by channel (in billion hours). Statista. Statista Inc.. Accessed: June 17, 2025. https://www.statista.com/statistics/681174/us-monthly-smartphone-app-website-time/
Verto Analytics. "Total Time Spent on Mobile Apps and Websites by Smartphone Users in The United States from June 2016 to December 2016, by Channel (in Billion Hours)." Statista, Statista Inc., 21 Feb 2017, https://www.statista.com/statistics/681174/us-monthly-smartphone-app-website-time/
Verto Analytics, Total time spent on mobile apps and websites by smartphone users in the United States from June 2016 to December 2016, by channel (in billion hours) Statista, https://www.statista.com/statistics/681174/us-monthly-smartphone-app-website-time/ (last visited June 17, 2025)
Total time spent on mobile apps and websites by smartphone users in the United States from June 2016 to December 2016, by channel (in billion hours) [Graph], Verto Analytics, February 21, 2017. [Online]. Available: https://www.statista.com/statistics/681174/us-monthly-smartphone-app-website-time/