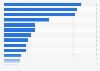
This statistic shows the results of a survey in which respondents were asked what kind of tea they normally drink at work or in the office in the United Kingdom (UK) in 2017. A majority of 44 percent of respondents drink black tea at work, followed by 42 percent who drink white tea.
Advertisement
Advertisement
What kind of tea do you usually drink at work / the office?*
Profit from the additional features of your individual account
Currently, you are using a shared account. To use individual functions (e.g., mark statistics as favourites, set
statistic alerts) please log in with your personal account.
If you are an admin, please authenticate by logging in again.
Learn more about how Statista can support your business.
Statista. (March 1, 2017). What kind of tea do you usually drink at work / the office?* [Graph]. In Statista. Retrieved June 20, 2025, from https://www.statista.com/statistics/682382/tea-consumption-at-work-type-united-kingdom-uk/
Statista. "What kind of tea do you usually drink at work / the office?*." Chart. March 1, 2017. Statista. Accessed June 20, 2025. https://www.statista.com/statistics/682382/tea-consumption-at-work-type-united-kingdom-uk/
Statista. (2017). What kind of tea do you usually drink at work / the office?*. Statista. Statista Inc.. Accessed: June 20, 2025. https://www.statista.com/statistics/682382/tea-consumption-at-work-type-united-kingdom-uk/
Statista. "What Kind of Tea Do You Usually Drink at Work / The Office?*." Statista, Statista Inc., 1 Mar 2017, https://www.statista.com/statistics/682382/tea-consumption-at-work-type-united-kingdom-uk/
Statista, What kind of tea do you usually drink at work / the office?* Statista, https://www.statista.com/statistics/682382/tea-consumption-at-work-type-united-kingdom-uk/ (last visited June 20, 2025)
What kind of tea do you usually drink at work / the office?* [Graph], Statista, March 1, 2017. [Online]. Available: https://www.statista.com/statistics/682382/tea-consumption-at-work-type-united-kingdom-uk/