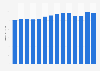
In 2023, the value of domestic processed food and beverages exported from Hong Kong reached around 8.03 billion Hong Kong dollars. This showcased an increase of about 18 percent compared to the previous year.
Value of domestic made processed food and beverage exports from Hong Kong from 2014 to 2023
(in billion Hong Kong dollars)
Adjust the presentation of the statistic and data points.
Share the statistic on social media channels or embed the statistic in your
website using "Embed Code", where available.
Cite this statistic and select one of the following formats: APA, Chicago, Harvard, MLA & Bluebook.
Print the statistic including description and metadata.
Chart type
Value of domestic made processed food and beverage exports from Hong Kong from 2014 to 2023
Share this statistic
You have no right to use this feature.
Make sure to contact us if you are interested in scientific citation.
You can upgrade your account to enable this functionality for all statistics.
This feature is not available with your current account.Request access
One Hong Kong dollar equals about 0.13 U.S. dollars and 0.12 euros (as of September 2024). Figures have been rounded. Figures for earlier years have been taken from previous publications.
Learn more about how Statista can support your business.
HKTDC. (August 6, 2024). Value of domestic made processed food and beverage exports from Hong Kong from 2014 to 2023 (in billion Hong Kong dollars) [Graph]. In Statista. Retrieved May 30, 2025, from https://www.statista.com/statistics/685044/hong-kong-domestic-processed-food-and-beverage-export-value/
HKTDC. "Value of domestic made processed food and beverage exports from Hong Kong from 2014 to 2023 (in billion Hong Kong dollars)." Chart. August 6, 2024. Statista. Accessed May 30, 2025. https://www.statista.com/statistics/685044/hong-kong-domestic-processed-food-and-beverage-export-value/
HKTDC. (2024). Value of domestic made processed food and beverage exports from Hong Kong from 2014 to 2023 (in billion Hong Kong dollars). Statista. Statista Inc.. Accessed: May 30, 2025. https://www.statista.com/statistics/685044/hong-kong-domestic-processed-food-and-beverage-export-value/
HKTDC. "Value of Domestic Made Processed Food and Beverage Exports from Hong Kong from 2014 to 2023 (in Billion Hong Kong Dollars)." Statista, Statista Inc., 6 Aug 2024, https://www.statista.com/statistics/685044/hong-kong-domestic-processed-food-and-beverage-export-value/
HKTDC, Value of domestic made processed food and beverage exports from Hong Kong from 2014 to 2023 (in billion Hong Kong dollars) Statista, https://www.statista.com/statistics/685044/hong-kong-domestic-processed-food-and-beverage-export-value/ (last visited May 30, 2025)
Value of domestic made processed food and beverage exports from Hong Kong from 2014 to 2023 (in billion Hong Kong dollars) [Graph], HKTDC, August 6, 2024. [Online]. Available: https://www.statista.com/statistics/685044/hong-kong-domestic-processed-food-and-beverage-export-value/
Profit from additional features with an Employee Account
Please create an employee account to be able to mark statistics as favorites.
Then you can access your favorite statistics via the star in the header.
Profit from the additional features of your individual account
Currently, you are using a shared account. To use individual functions (e.g., mark statistics as favourites, set
statistic alerts) please log in with your personal account.
If you are an admin, please authenticate by logging in again.