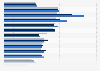
This statistic shows the defection rate of price-sensitive property and casualty customers as opposed to normal customers worldwide in 2016, by country. In the United States, price-sensitive P&C customers were 2.6 times more likely to churn compared with other auto insurance customers.
Advertisement
Advertisement
Defection rate of price-sensitive property and casualty in comparison to normal customers worldwide in 2016*, by country
Characteristic
Likelihood of price-sensitive customers defection rate as compared to normal customers
Adjust the presentation of the statistic and data points.
Share the statistic on social media channels or embed the statistic in your
website using "Embed Code", where available.
Cite this statistic and select one of the following formats: APA, Chicago, Harvard, MLA & Bluebook.
Print the statistic including description and metadata.
Chart type
Defection rate of price-sensitive property and casualty in comparison to normal customers worldwide in 2016*, by country
Share this statistic
You have no right to use this feature.
Make sure to contact us if you are interested in scientific citation.
You can upgrade your account to enable this functionality for all statistics.
This feature is not available with your current account.Request access
from 19 countries: Australia, Brazil, Canada, China, France, Germany, Hong Kong, Indonesia, Italy, Japan, Malaysia, Mexico, Poland, Singapore, South Korea, Spain, Switzerland, the UK and the US
Method of interview
Panel survey
Supplementary notes
*Relative to other auto insurance customers in the past 12 months.
Learn more about how Statista can support your business.
Bain & Company. (September 14, 2016). Defection rate of price-sensitive property and casualty in comparison to normal customers worldwide in 2016*, by country [Graph]. In Statista. Retrieved June 15, 2025, from https://www.statista.com/statistics/692501/churn-rate-of-price-sensitive-vs-normal-pandc-customers-by-country/
Bain & Company. "Defection rate of price-sensitive property and casualty in comparison to normal customers worldwide in 2016*, by country." Chart. September 14, 2016. Statista. Accessed June 15, 2025. https://www.statista.com/statistics/692501/churn-rate-of-price-sensitive-vs-normal-pandc-customers-by-country/
Bain & Company. (2016). Defection rate of price-sensitive property and casualty in comparison to normal customers worldwide in 2016*, by country. Statista. Statista Inc.. Accessed: June 15, 2025. https://www.statista.com/statistics/692501/churn-rate-of-price-sensitive-vs-normal-pandc-customers-by-country/
Bain & Company. "Defection Rate of Price-sensitive Property and Casualty in Comparison to Normal Customers Worldwide in 2016*, by Country." Statista, Statista Inc., 14 Sep 2016, https://www.statista.com/statistics/692501/churn-rate-of-price-sensitive-vs-normal-pandc-customers-by-country/
Bain & Company, Defection rate of price-sensitive property and casualty in comparison to normal customers worldwide in 2016*, by country Statista, https://www.statista.com/statistics/692501/churn-rate-of-price-sensitive-vs-normal-pandc-customers-by-country/ (last visited June 15, 2025)
Defection rate of price-sensitive property and casualty in comparison to normal customers worldwide in 2016*, by country [Graph], Bain & Company, September 14, 2016. [Online]. Available: https://www.statista.com/statistics/692501/churn-rate-of-price-sensitive-vs-normal-pandc-customers-by-country/
Advertisement
Profit from additional features with an Employee Account
Please create an employee account to be able to mark statistics as favorites.
Then you can access your favorite statistics via the star in the header.
Profit from the additional features of your individual account
Currently, you are using a shared account. To use individual functions (e.g., mark statistics as favourites, set
statistic alerts) please log in with your personal account.
If you are an admin, please authenticate by logging in again.